
By using this website, you agree to our Terms of Use (click here)

Before we begin, note two things:
1. Acumatica is not currently as heavily into Replenishment as some other more Distribution-focused ERP systems.
2. Because of #1, NetStock (click here) is a popular 3rd-party ISV product add-on. NetStock runs dozens of replenishment algorithms on your data and automatically picks the best one based on comparing your historical usage to the historical predicted usage. Acumatica runs one replenishment algorithm called "Moving Average" and that's what the rest of this post is about.
I'm using this Discussion Topic to track some notes about the Demand Forecast Model value of Moving Average that you can find on the REPLENISHMENT INFO tab of the Stock Items (IN202500) screen here:

That Moving Average option is such a small unassuming value, but there is a lot behind it because it triggers the automatic calculation of replenishment parameters.
Those replenishment parameters are calculated by clicking PROCESS on the Calculate Replenishment Parameters (IN508500) screen.
Then you view the results of the calculated parameters on the Apply Replenishment Parameters (IN509500) screen. You can also use this screen to view the calculated variables that get used by replenishment parameter calculation formula which include:
1. Daily Demand Forecast
2. Daily Demand Forecast Error (STDEV)
3. Lead Time Average
4. Lead Time STDEV
When you click PROCESS on the Apply Replenishment Parameters (IN509500) screen, that pushes the calculated parameters into the Stock Items (IN202500) and Item Warehouse Details (IN204500) screens.
Those calculated parameters then get used when you run replenishment by clicking process on the Prepare Replenishment (IN508000) screen.
Note that all three replenishment screens can be scheduled to run unattended (overnight, twice a day, etc.).
The complicated part (in my opinion) is the replenishment parameter calculation that happens when you click PROCESS on the Calculate Replenishment Parameters (IN508500) screen.
This help article describes the replenishment parameter calculation formula in detail, including a screenshot from the help article:
https://help-2019r2.acumatica.com/Help?ScreenId=ShowWiki&pageid=360c2e43-48a7-489e-9d4c-c680e491a147
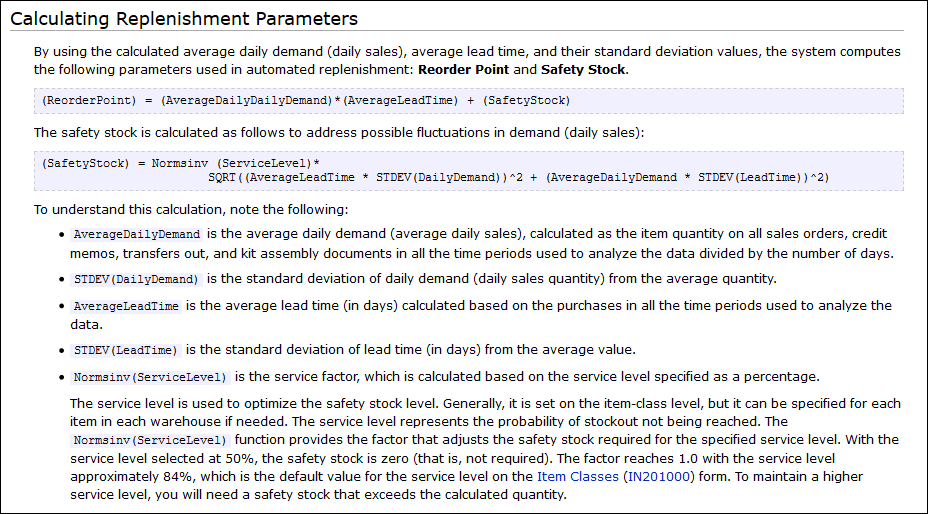
Before we try to understand the formula, we have to understand the calculation of the variables in the screenshot above that go into the formula:
1. AverageDailyDemand (I'm pretty sure that "AverageDailyDailyDemand" in the screenshot above is a typo and should be "AverageDailyDemand")
2. AverageLeadTime
3. SafetyStock
4. ServiceLevel
5. LeadTime
There are some notes in the help article about the variables. There is also a help article which gives an example using actual numbers which helps to understand the formula:
https://help-2019r2.acumatica.com/Help?ScreenId=ShowWiki&pageid=932ad390-6561-4cbc-b1ba-d2eb208b2702
But that's not enough for me. I wanted to understand this at a deeper level. That's why I'm taking the notes on this Discussion Topic.
This is not your typical Discussion Topic. I'm going to continue to revisit this first post and make edits to it as I learn more. But still feel free to chime in with your own posts below and I'll incorporate suggestions, lessons learned, questions, etc. into this first post. You can see the last time I modified this first post by looking on the bottom of this first post.
Ready? Let's dive in.
First, let's take these variables one at a time.
1. AverageDailyDemand
2. AverageLeadTime
To calculate Lead Time, Acumatica looks at Purchase Receipts. It takes Date on the Purchase Receipts (PO302000) screen and subtracts Requested on the DOCUMENT DETAILS tab of the Purchase Orders (PO301000) screen for the related purchase order line that was received.
Then it takes all of the Lead Time values, adds them up, and divides by the number of Purchase Receipts.


Hi Tim
The following spreadsheet is what I use to demonstrate the calculation of safety stock and reorder point.
Replenishment-Calculation-of-Suggested-Safety-Stock-and-Reoorder-KC.xlsx
It is never 100% accurate but can be mighty close, you should also set the lot size of the item to be 1 to removed decimal places as well.

Tim
Thank you for addressing this replenishment topic. Replenishment is critical to my business.
Doug McBride
Tim
Can Acumatica do this for us out of the box: In addition to item replenishment, we need "category" replenishment. For example, we will have a product category that has 10 SKUs in the category and we will purchase each SKU 10 items deep (for a total of 100 items at peak level). No SKU is ever re-purchased. Customer demands new SKUs. When a SKU is sold, a new SKU that meets the requirements of the category is purchased to replaced the sold out SKU. So we need replenishment based on "category" and not on SKU. We need Acumatica to tell us we need to reorder additional SKUs to keep the "category" at the correct inventory level. Can Acumatica do this for us out of the box?
@carl-brooks - Thanks for the spreadsheet. It's nice that Excel has a NORMSINV formula which matches the name of the formula in the Acumatica help file.
@doug-mcbride - Trying to understand this more. Does every Category always have 10 Items in it or can the number of Items vary? Do you always order the Items in the category evenly, the same number of each one?
@brandon - I haven't checked yet to see if Transfers are included in the Lead Time calculation. If they are, then you could maybe setup a Warehouse in China, then do a Transfer Order from the China Warehouse to your Main Warehouse.
Tim:
Re: @doug-mcbride - Trying to understand this more. Does every Category always have 10 Items in it or can the number of Items vary? Do you always order the Items in the category evenly, the same number of each one?
The 10 items in a category was an example. Each of a 100 to 200 product categories would have a different number of "target SKUs". So, no, each product category would NOT have 10 items in it. Some product categories would have as few as 2 SKUs in it and some categories would have up to 50 skus in it. We change the number of "target SKUs" in a product category as the market demands move and change.
The 10 items in a category was an example. Each of a 100 to 200 product categories would have a different number of "target SKUs".
Taking the 2 items in a category example since there are less items, are you wanting replenishment to pool the supply and demand to make a suggestion for the quantity needed for the entire category? If so, then how would you determine how much to buy of each item?

I would be very careful with the model of moving average. I would create a spreadsheet with my weekly past demand for the last 6 months (24weeks), and apply the method at week 10 to see what it would have been predicted for week 11, then at week 11 to see the prediction for week12, etc.
Then i can compare the predictions with my actuals, and see if the method worked. Do I make sense?
If the demand is pretty stable (no seasonality), then the method may be okay. If there is seasonality then you need NetStock, or even better EazyStock.
Good luck
Toon