— The Forums are now read-only —
— All new activity now takes place here: —

Hi, We have a customer that want to have a pie chart of sales by Item Class. Creating such a report is easy enough. However, getting the data represented on the report as a pie chart is proving a pit frustrating. In the report there is a group based upon the ItemClassCD. I have sub totals for each item class for sales and cost of sales. The report is basically a copy of the Sales Profitability by Item Class and Item.
My question is how can I setup a pie chart that has a data point dynamically set for each item class that appears on the report. It seems it must be possible.


I haven't used Charts in Report Designer personally, only in Dashboards.
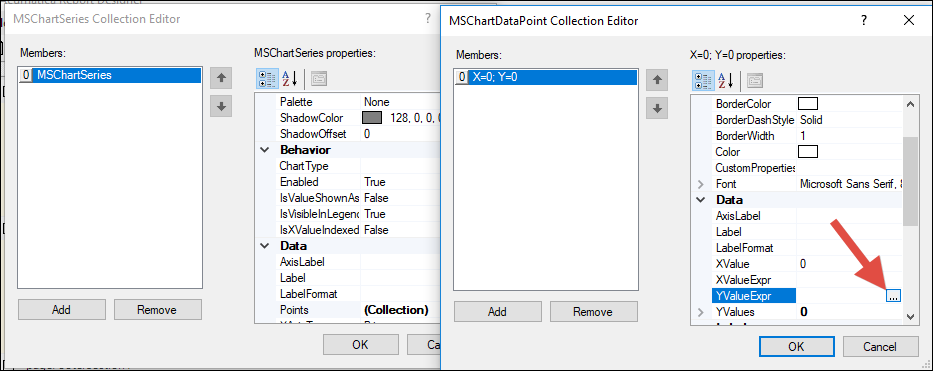
You can't enter an expression if you click the ... button?
By using this website, you agree to our Terms of Use (click here)
