
By using this website, you agree to our Terms of Use (click here)

Hi, We have a customer that want to have a pie chart of sales by Item Class. Creating such a report is easy enough. However, getting the data represented on the report as a pie chart is proving a pit frustrating. In the report there is a group based upon the ItemClassCD. I have sub totals for each item class for sales and cost of sales. The report is basically a copy of the Sales Profitability by Item Class and Item.
My question is how can I setup a pie chart that has a data point dynamically set for each item class that appears on the report. It seems it must be possible.


I haven't used Charts in Report Designer personally, only in Dashboards.
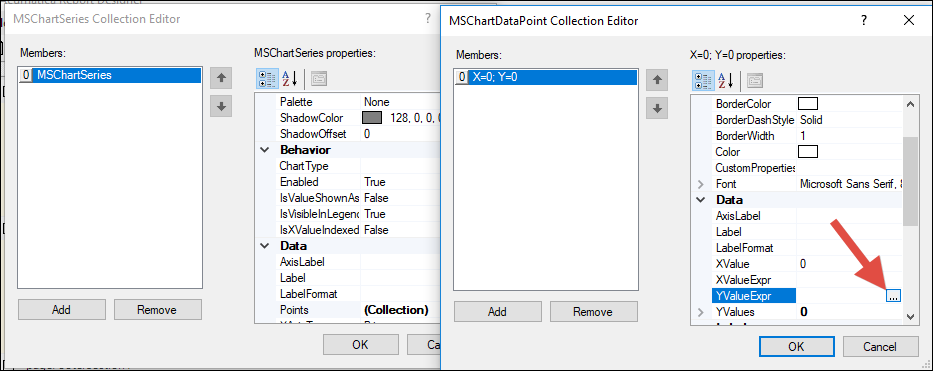
You can't enter an expression if you click the ... button?
Online Members
