
By using this website, you agree to our Terms of Use (click here)
How can I create a Report in Acumatica so that I can compare the Sales for 12 months?
I have created a 12 month rolling report using Column Sets as discussed in this Forum but it can create a report only if its of GL. The report that I am trying to create is from AR.

I would probably start with a GI that reads from ARTran as the base. Then do some joins to pickup Customer Class and Sales Reps.
Sales Reps can get tricky because it depends on how you are calculating commissions. Acumatica will allow you to have separate salespeople on each line of an invoice. Or multiple salespeople at the document level of the invoice. Or you could just use the Default Salesperson field on the Salesperson Commission tab of the Invoices and Memos screen.
Margin % is also tricky. They do store the cost in ARTran, but I'm not sure how accurate it is. It might be accurate, I'm just not sure.
If you get the GI right, then you could put a Pivot Table on top of it.
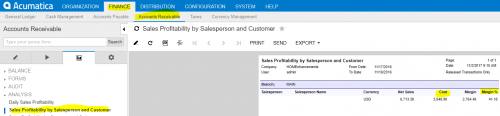
Definitely critique the Cost data that would be used to calculate margin. You can see in the Sales Profitability by Salesperson and Customer report that you highlighted above that ARTran.Cost is the field used:

But you might want to work with your VAR to get more comfortable that the ARTran.Cost data is actually correct in all situations.
Online Members

