
By using this website, you agree to our Terms of Use (click here)

I get to demo some of the new reporting features in 2020 R1 during the Acumatica 2020 R1 Feature Update session at Summit 2020.
Here are some notes about what I get to demo.
1. Additional CRM Reports
Acumatica continues to invest not only in Pivot Table functionality (more on that later), but in improving the pre-built Pivot Tables that are available out of the box.
There are several new Pivot Tables available in the CRM module:
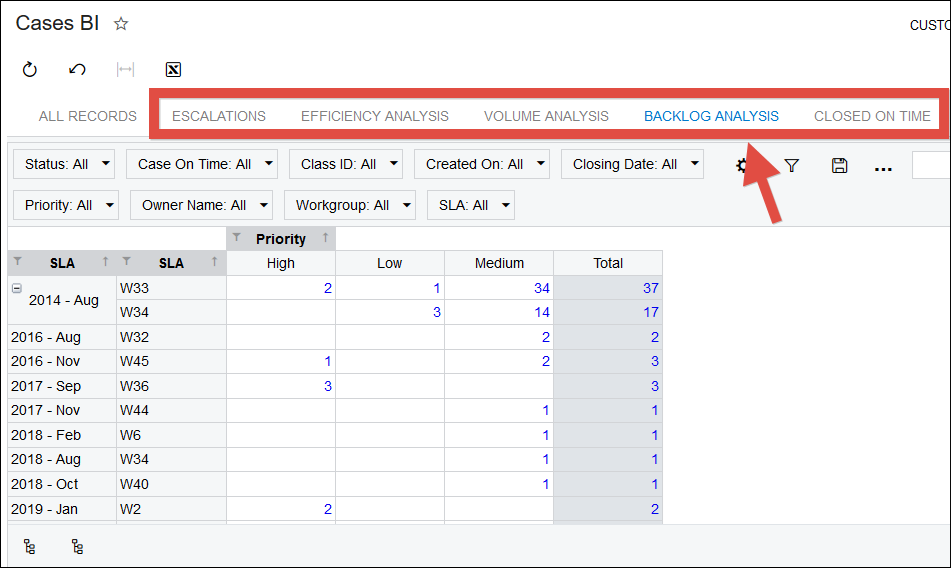
Support -> Inquiries -> Cases BI (CR3060BI)
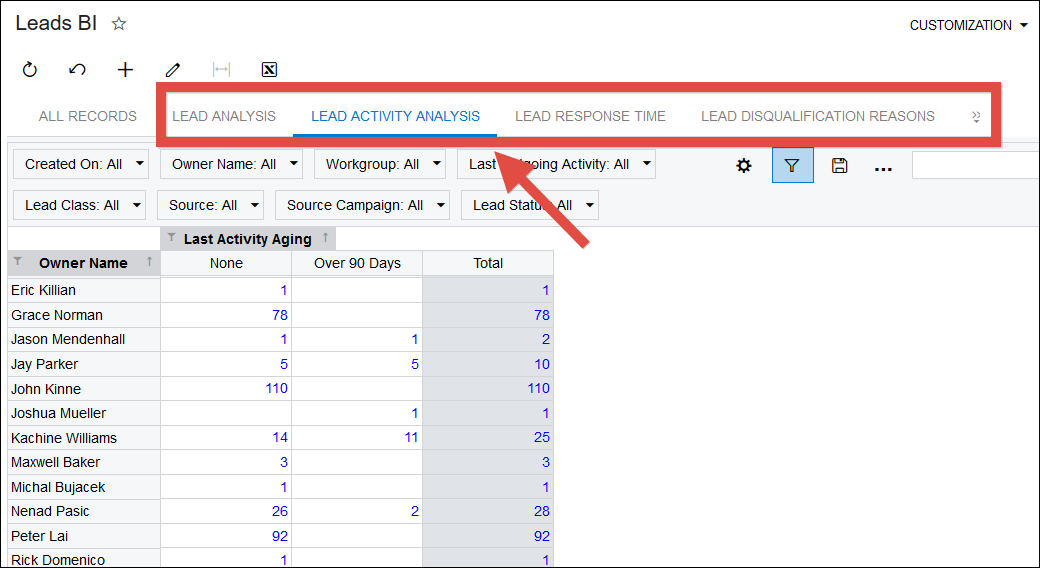
Marketing -> Inquiries -> Leads BI (CR3010BI)
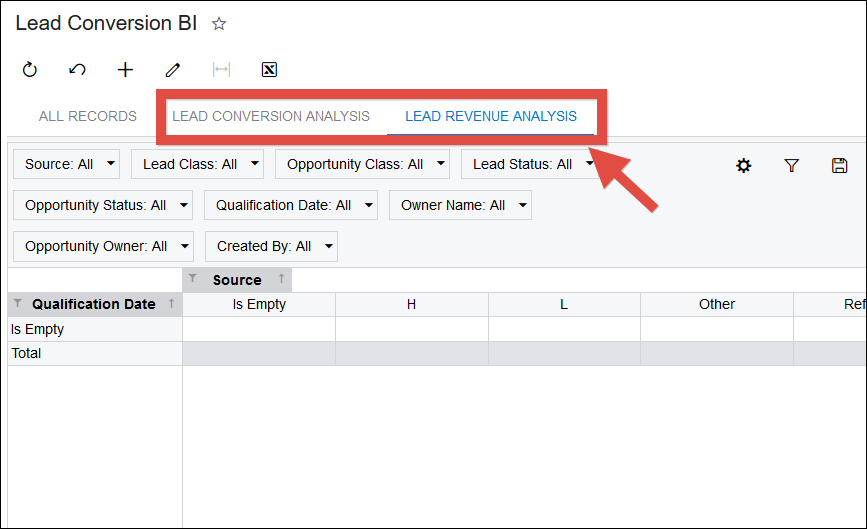
Marketing -> Inquiries -> Lead Conversion BI (CR3011BI)
2. Distinct Counts & Percentages in Pivots
Personally, I LOVE how Acumatica continues to invest in Pivot Table functionality.
The new Distinct Count feature is another example of that investment.
Distinct Count is VERY useful.
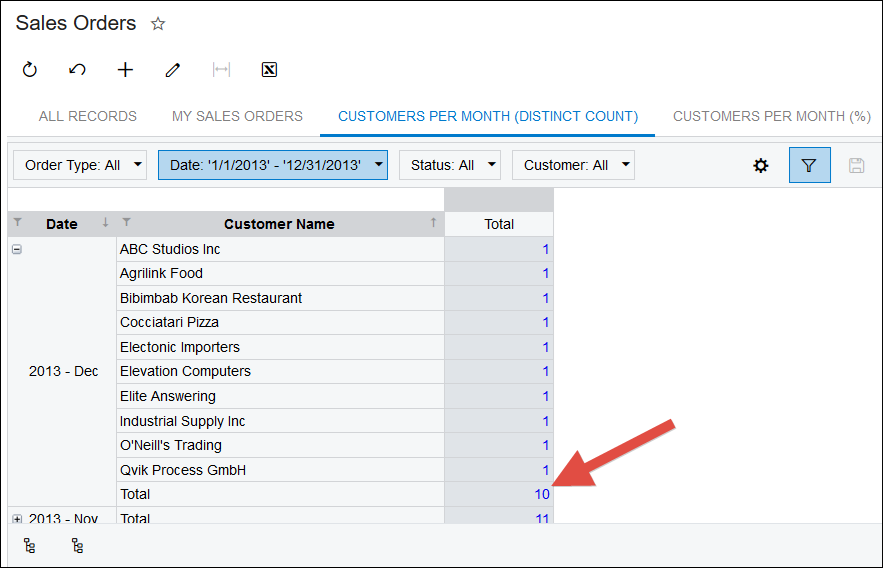
Consider this Pivot Table done in 2019 R2:
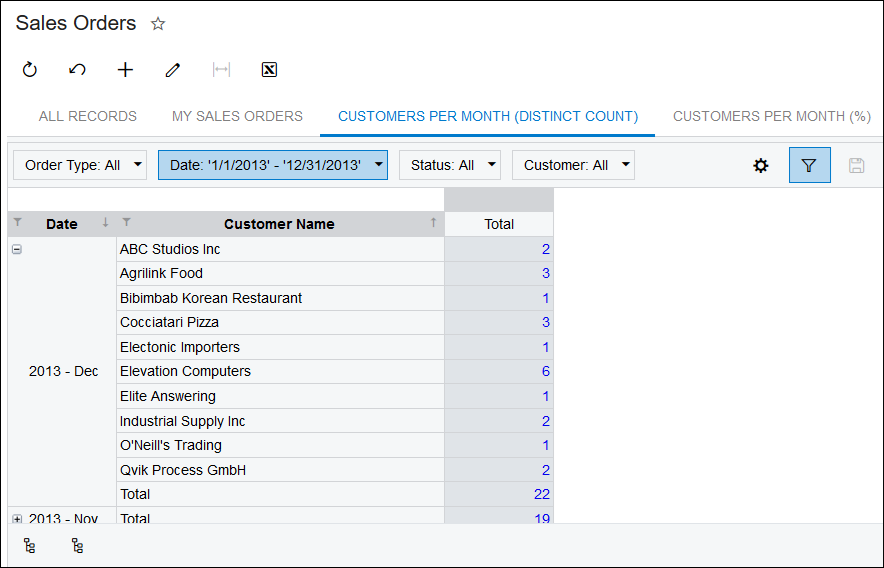
In this Pivot Table, I wanted to get a count of how many Customers are involved with December 2013 Sales Orders in the Pivot Table above.
My Total count says 22. But if you count the Customers in the screenshot, you can see that there are only 10 customers.
Why the difference between 22 and 10? Well, it’s because prior to 2020 R1, Acumatica Pivot Tables only had the ability to count the number of records, Sales Orders in this case. There are 22 Sales Orders in December 2013, so we can 22.
Prior to 2020 R1, we only had these possible Aggregate values:
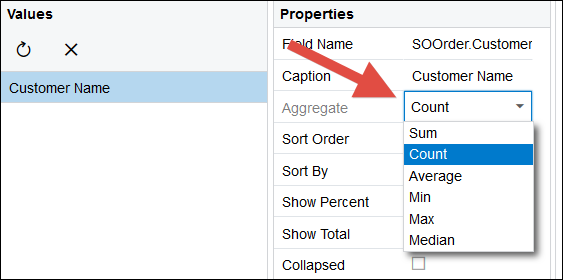
So it didn’t matter what field we counted. The count total was always the same because it counted the records, not the number of unique values in the field that we were counting.
Now in 2020 R1 we have both Count All and Count Distinct:
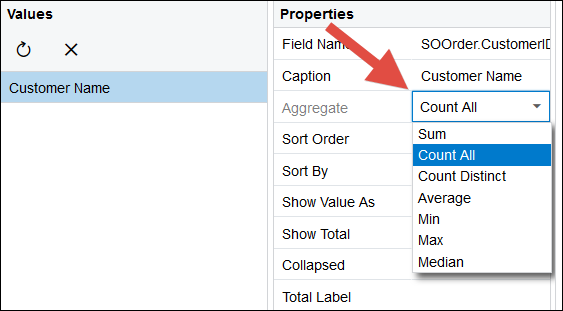
If we use Count Distinct, now we get the 10 Customers result that we were expecting:
There are also some new percentage options available.
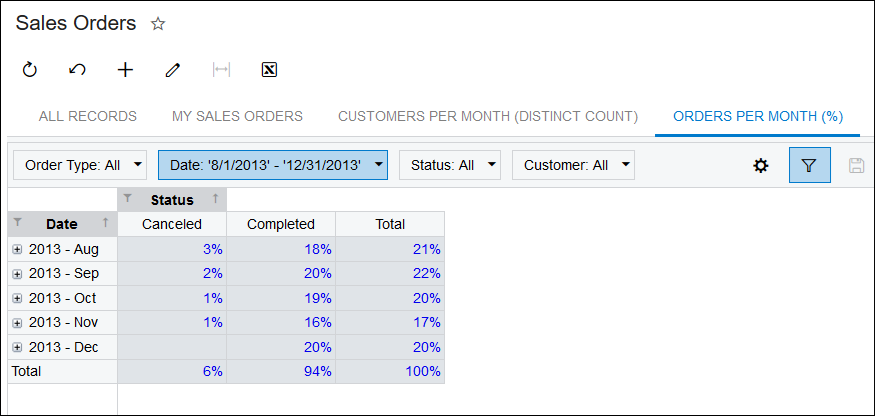
Let’s take this Pivot Table which shows a count of Sales Orders by Month going down and by Status going across.
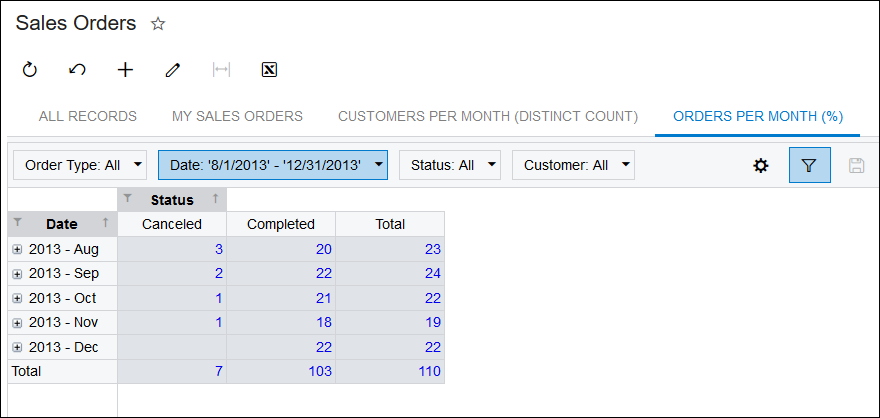
Prior to 2020 R1, we only had a checkbox called Show Percent. If we checked the Show Percent box, then the numbers showed as percentages:
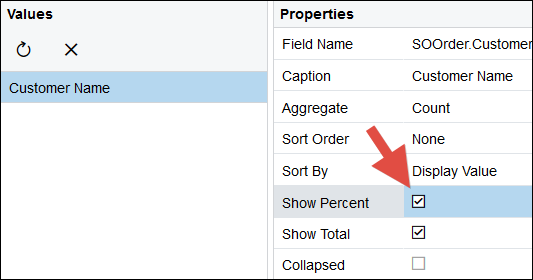
But we couldn’t control how the percentages are calculated.
Note in the screenshot above that every percentage is a percentage of the Grand Total. If you take the numbers from earlier, the Grand Total is 110. Every percentage is showing the numbers divided by 110.
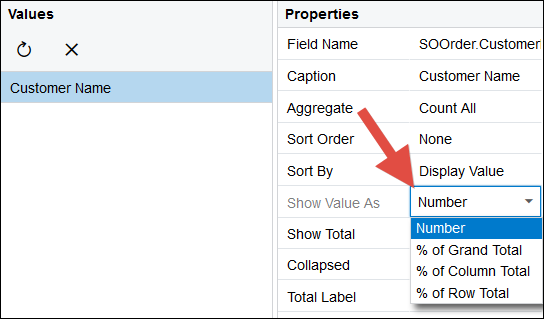
Now in 2020 R1, we have more control over how the percentages are calculated.
The Show Percent checkbox has been changed to Show Value As with 4 options: Number, % of Grand Total, % of Column Total, and % of Row Total.
If we select Number, then we get the Sales Order counts like we already saw in a previous screenshot.
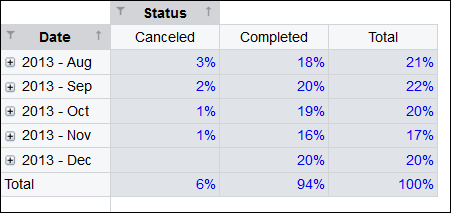
If we select % of Grand Total, then we get this, same as checking the Show Percent checkbox prior to 2020 R1:
If we select % of Column Total, then we get this (hmmm, interesting):
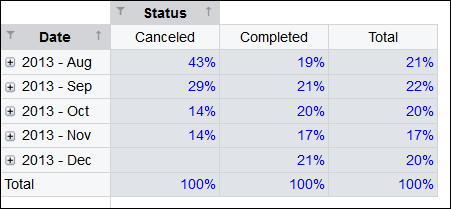
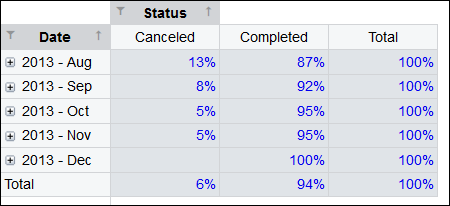
If we select % of Row Total, then we get this (hmmm, also interesting):
Before we leave the section on Pivot Table improvements, I just wanted to comment a little more about the new Count Distinct feature.
I really like the Count Distinct feature.
I used to say that Acumatica Pivot Tables are great, but don’t expect them to come anywhere close to Excel Pivot Tables.
Now, things have reversed in that there are things that Acumatica Pivot Tables do better than Excel Pivot Tables.
When you create a Regular Excel Pivot Table, you don’t have the opportunity to use Count Distinct.
Take this Pivot Table as an example. If you have a Table and you use Insert -> PivotTable like this:
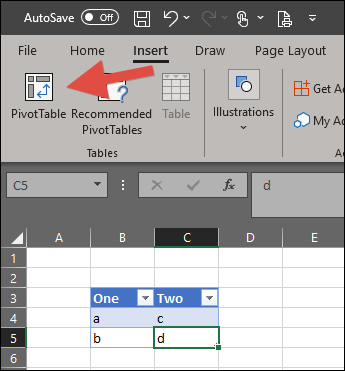
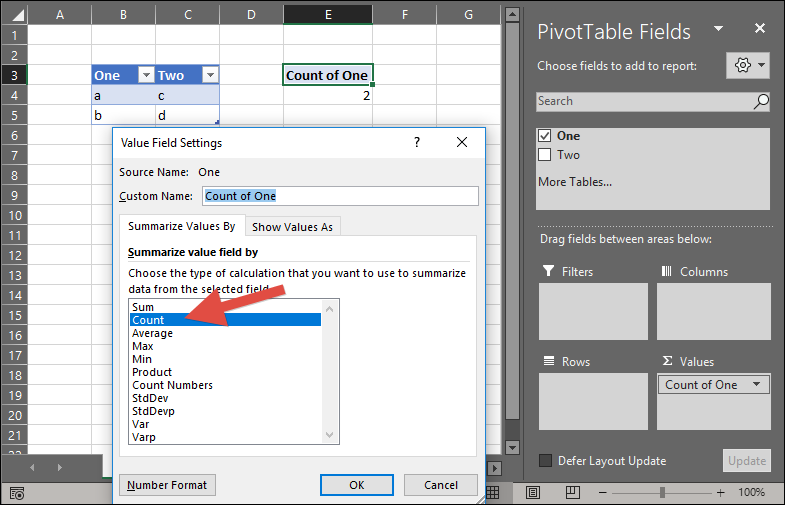
Then you can see that you can use Count, but not Count Distinct:
There actually is a way to do this in Excel, just not with Regular Pivot Tables. You have to use the Data Model in Excel. The Data Model used to be called Power Pivot and it’s actually Power BI lurking secretly behind-the-scenes in newer versions of Excel:
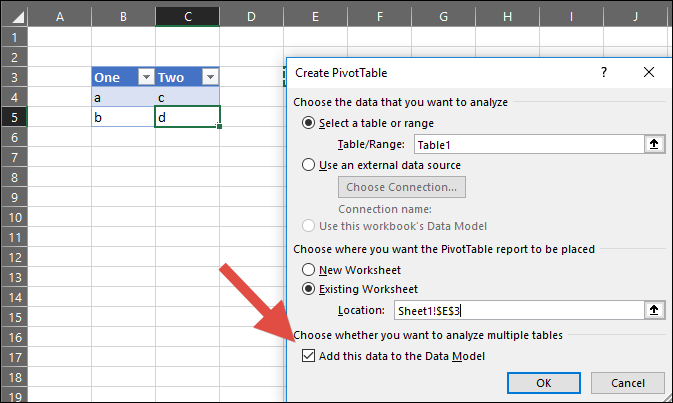
When you create a Pivot Table using the Data Model, you’ll see this extra option called Distinct Count (not Count Distinct, but it’s the same thing):
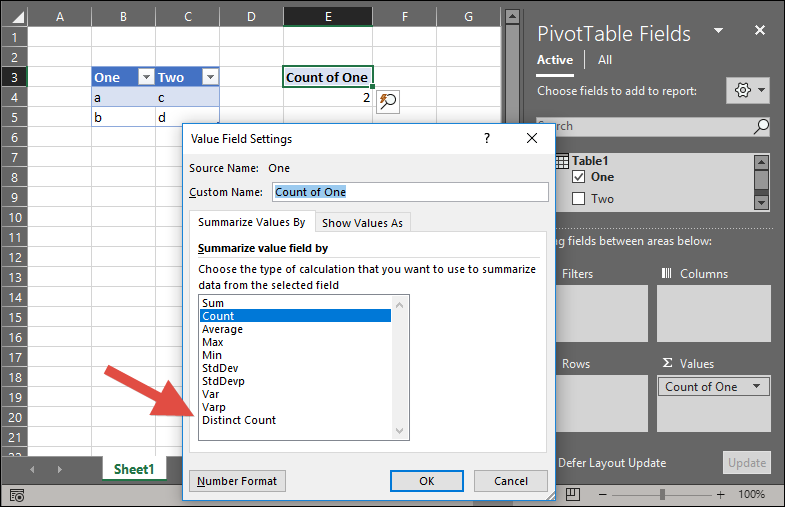
So I would make the argument that Count Distinct / Distinct Count is actually easier to do in Acumatica Pivot Tables than in Excel Pivot Tables.
3. Dashboard Caching and Refresh
This one is my favorite new 2020 R1 feature. It’s not that impressive at first, but it’s a big step in my opinion. Let’s look at it first, with more comments afterwards.
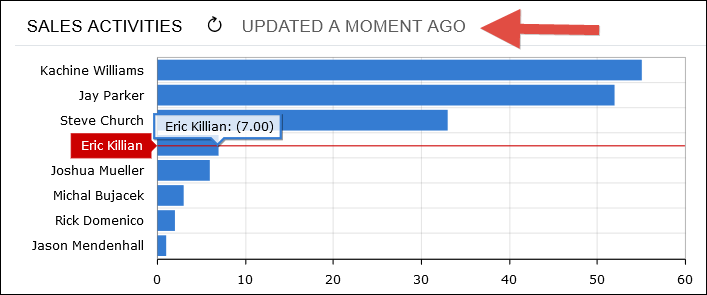
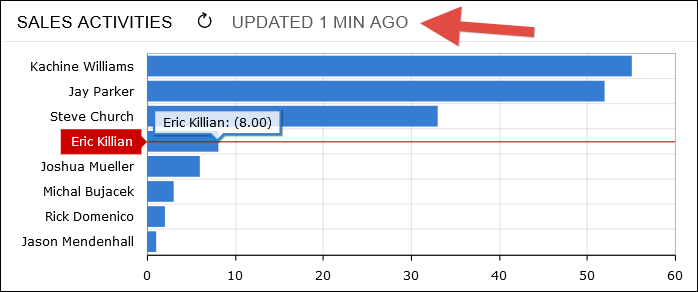
Here is a Dashboard Widget. Note two things:
1. Eric has 7 sales activities.
2. There is a new label called “UPDATED A MOMENT AGO”.
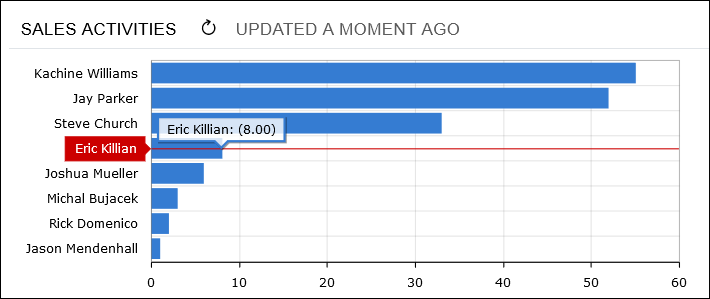
If I go enter a new sales activity for Eric, then refresh my browser window, we’ll see that Eric now has 8 sales activities:
Now, let’s edit the Dashboard Widget and change the brand new Refresh Data field to 30 min.
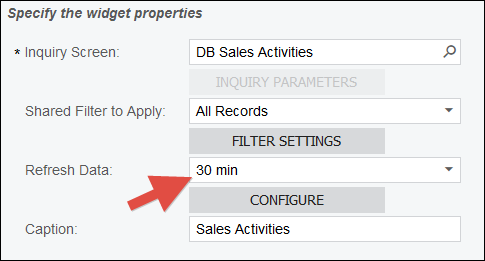
If I go enter a new sales activity for Eric, then refresh my browser window, we’ll notice two things:
1. Eric still only has 8 sales activities.
2. The label now says “UPDATED 1 MIN AGO”:
I can keep refreshing my browser as many times as I want, but Eric will continue to show 8 sales activities until the Dashboard Widget is 30 minutes old. Then the Dashboard Widget will update.
This might not seem like a big deal, but I think it’s a big deal.
The reason why I think this is a big deal is that this takes Acumatica Dashboards a step closer to Business Intelligence.
One of the key things in Business Intelligence is that calculations can take a while to refresh so you only refresh them periodically, often only once per day. Now Acumatica Dashboards can also do scheduled refresh.
This does not mean that Acumatica Dashboards do what a true Business Intelligence solution does. But it’s a step in that direction.
4. New Power BI App
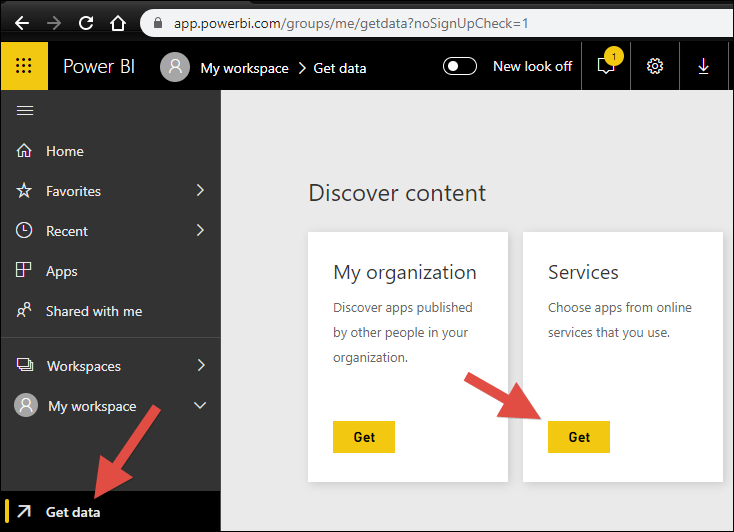
If you go to PowerBI.com, Get data, and Services -> Get like this:
You’ll see that there are no results when you search for “acumatica" (which my browser things I misspelled) in what is called AppSource – Apps for Power BI:
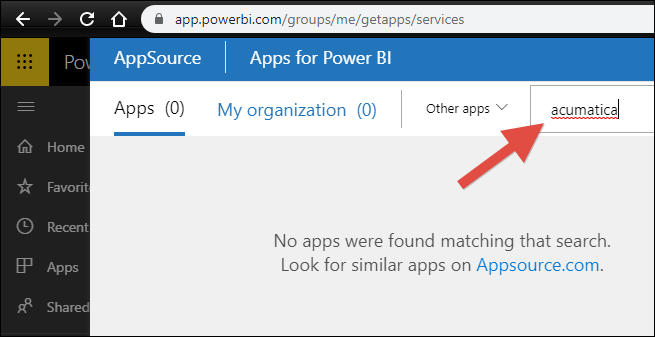
There actually used to be an Acumatica app here, but for some reason it was taken down.
Have no fear, a new Acumatica Power BI app is here!
I don’t know the exact timing, but Acumatica will be appearing in AppSource – Apps for Power BI in the near future.
For now, I was given access to a top secret, hush hush, glimpse into what this will look like:
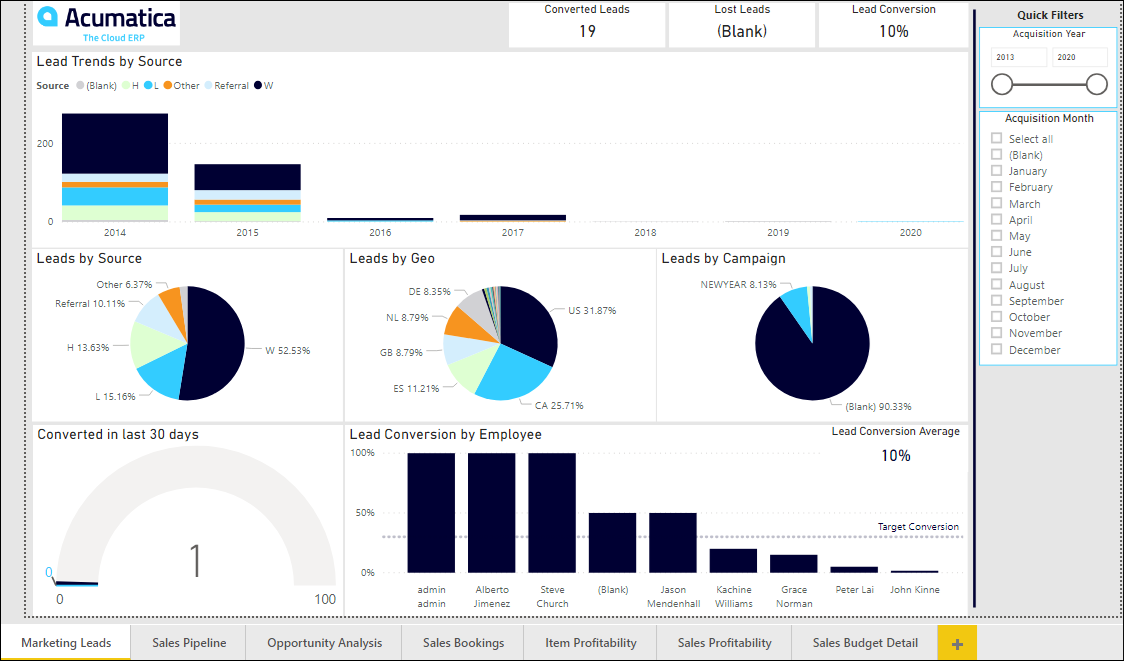
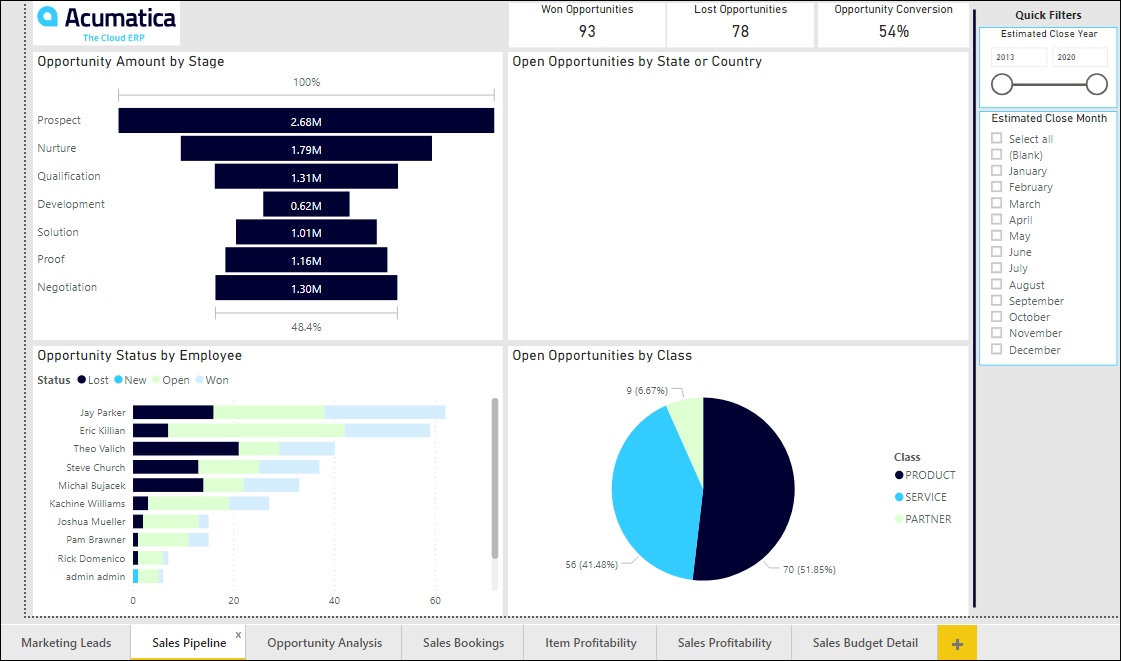
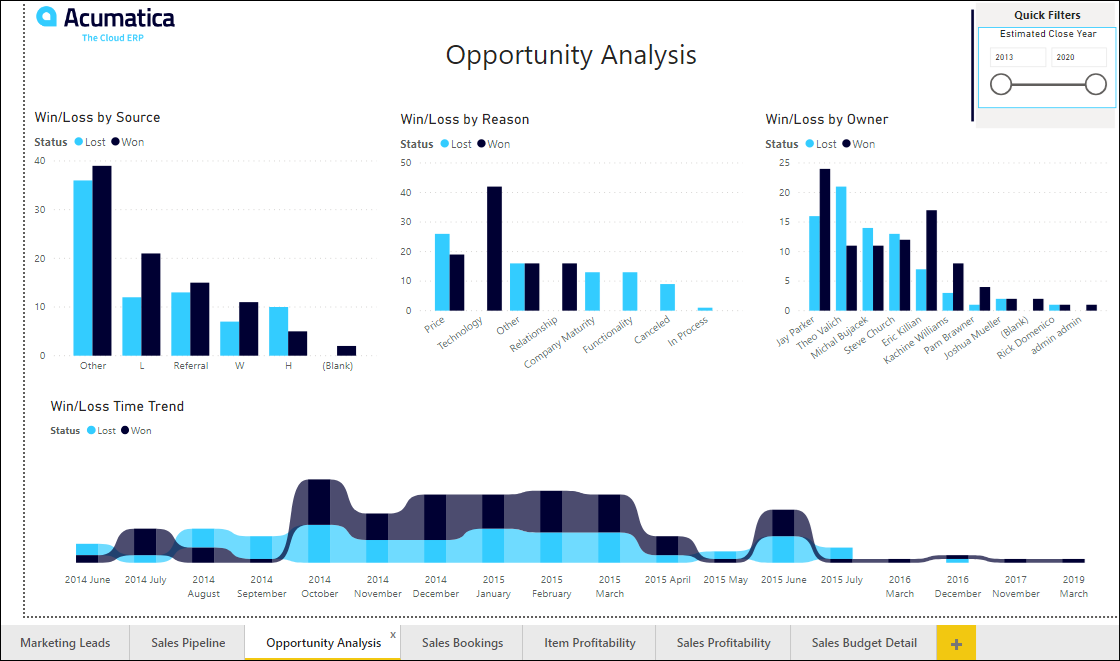
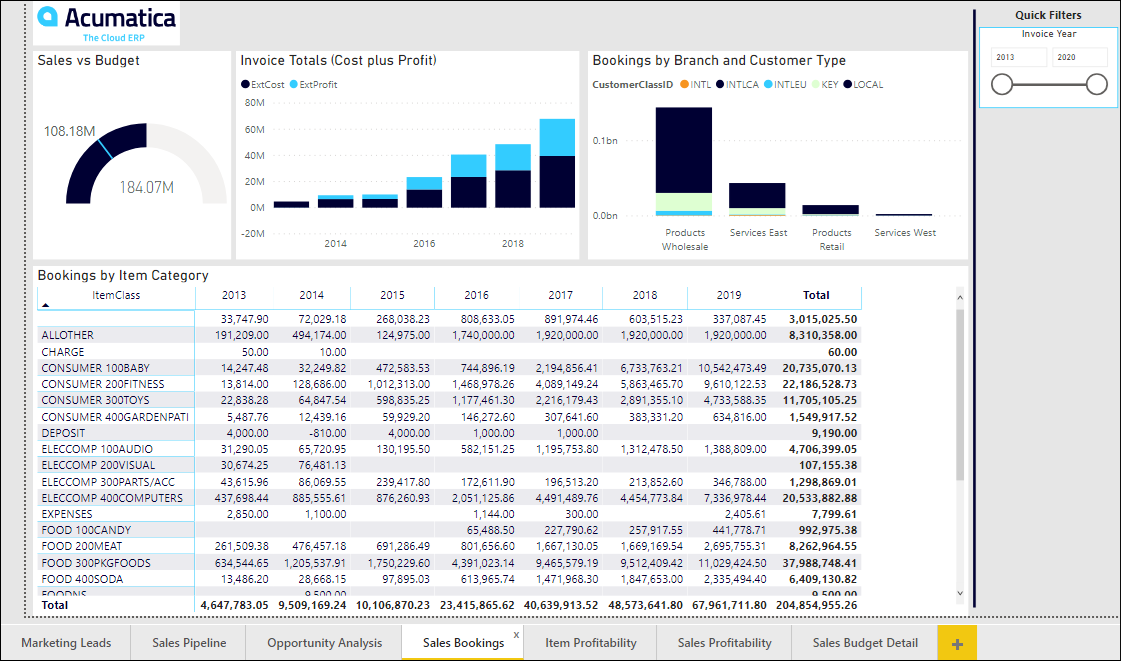
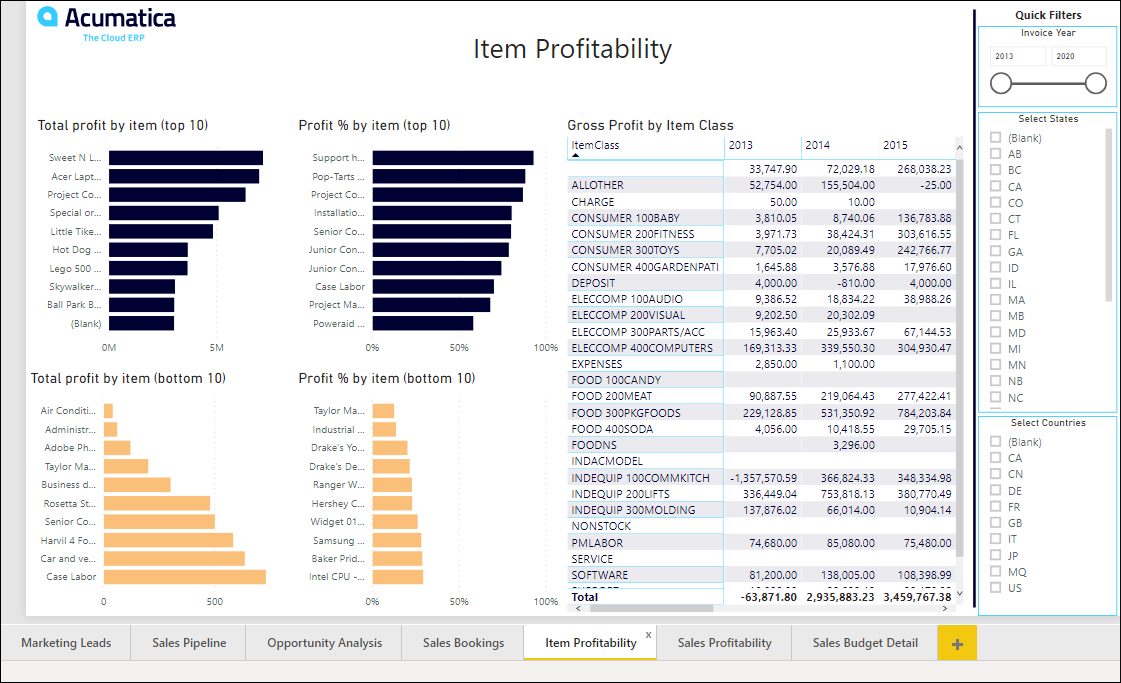
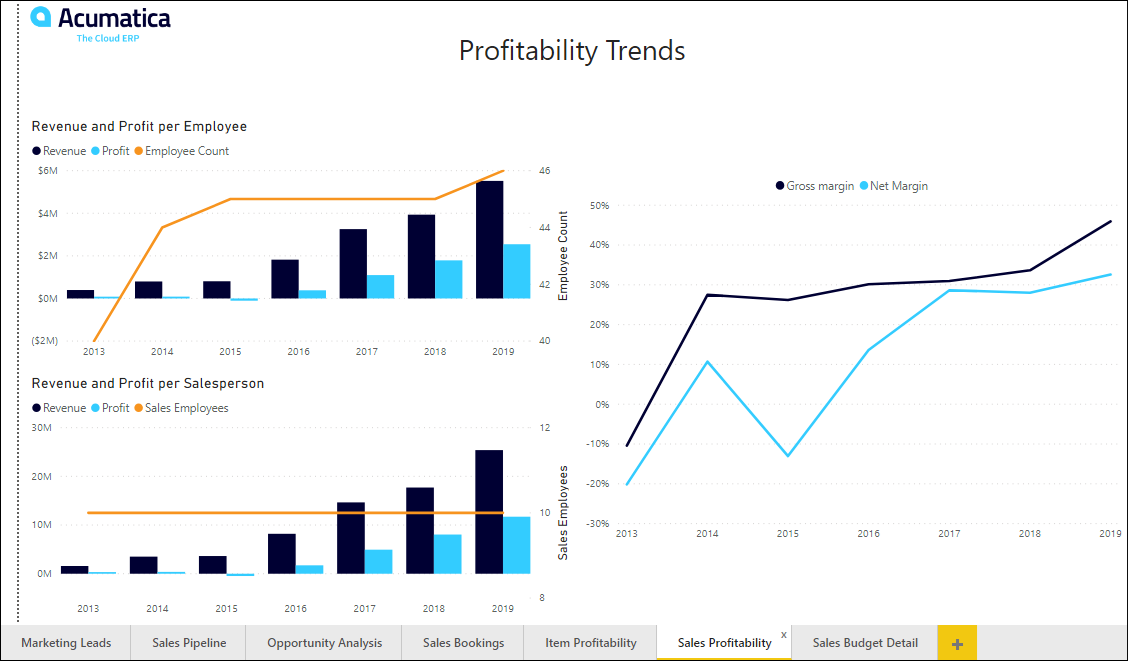
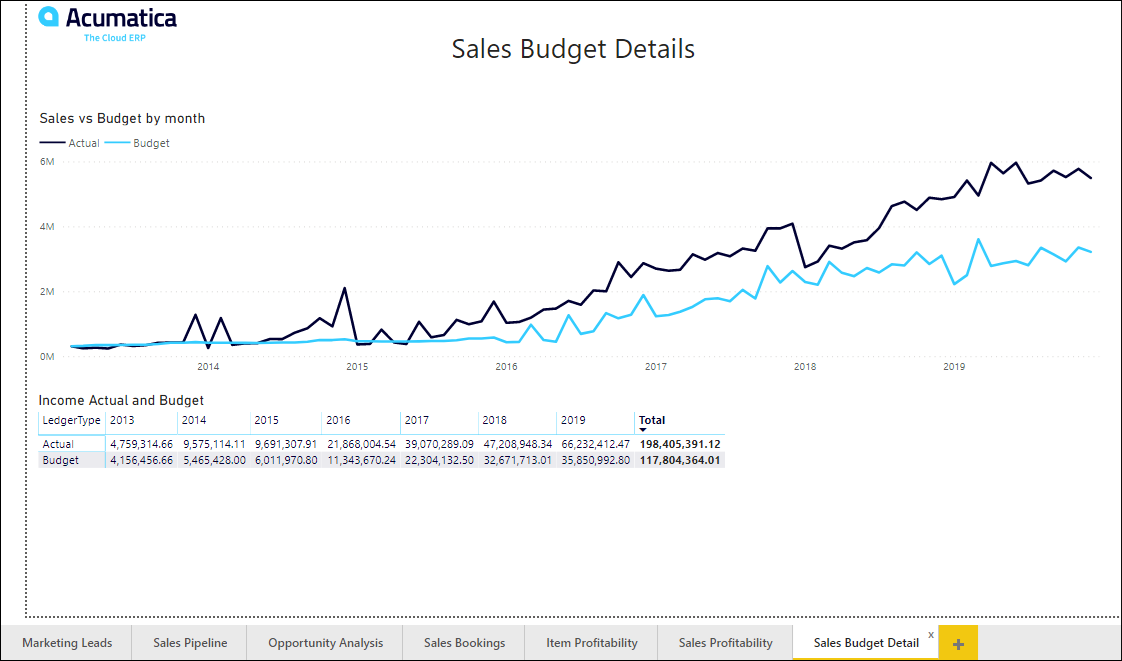
Let’s note a few things about the screenshots above.
First, the original Power BI app only looked at CRM data. This new Power BI app looks at CRM (Marketing Leads / Sales Pipeline / Opportunity Analysis), Accounts Receivable (Sales Bookings / Item Profitability / Sales Profitability), and General Ledger (Sales Budget Detail) data.
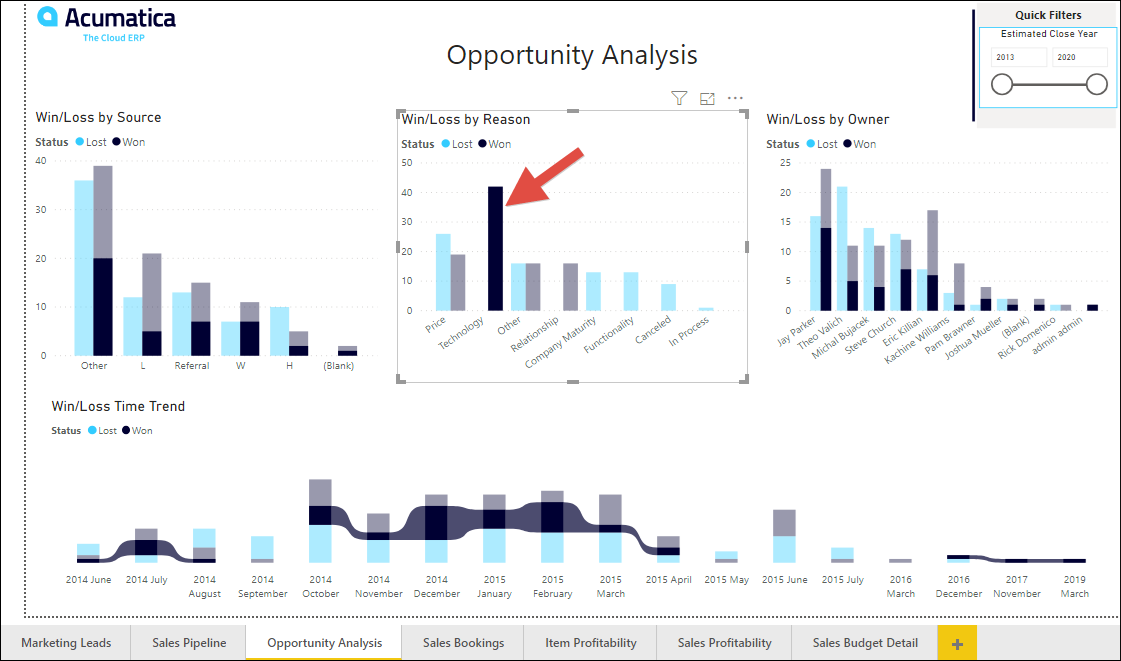
Second, in Power BI you can click on pretty much anything and it will filter the other widgets being displayed.
If I click on the bar highlighted in red, you can see that everything else gets filtered, but you can still see the totals in a lighter color. It makes exploring the data both fun and enlightening.
Third, everything that the Power BI app needs is supplied by Acumatica Generic Inquiries which are enabled for OData.
In Acumatica 2020 R1 these generic inquiries are available out-of-the-box:
BI-ARInvoices
BI-BranchCompany
BI-Customers
BI-Employees
BI-GLBudgetActual
BI-Leads
BI-Opportunities
BI-OppStages
Date
EmployeesByDate
So, in Acumatica 2020 R1, once the Power BI app is available in AppSource – Apps for Power BI, all you need to do is connect Power BI to your Acumatica instance and you’ll be able to enjoy a prepopulated Power BI app.
One final note: Keep in mind that there are a number of 3rd party ISV solutions for Business Intelligence with Acumatica if you want a more robust, supported Business Intelligence solution.

I also get to demo the new Control Type of Selector on the Attributes (CS205000) screen so jotting down some notes about that as well.
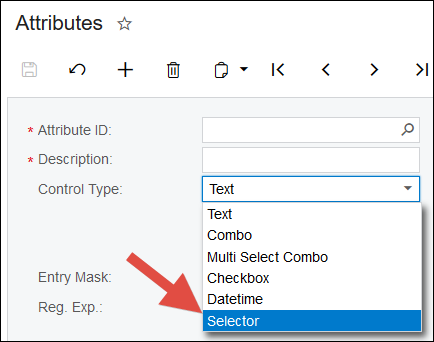
When you use a Control Type of Selector, you have two more fields to populate:
Schema Control
Schema Field
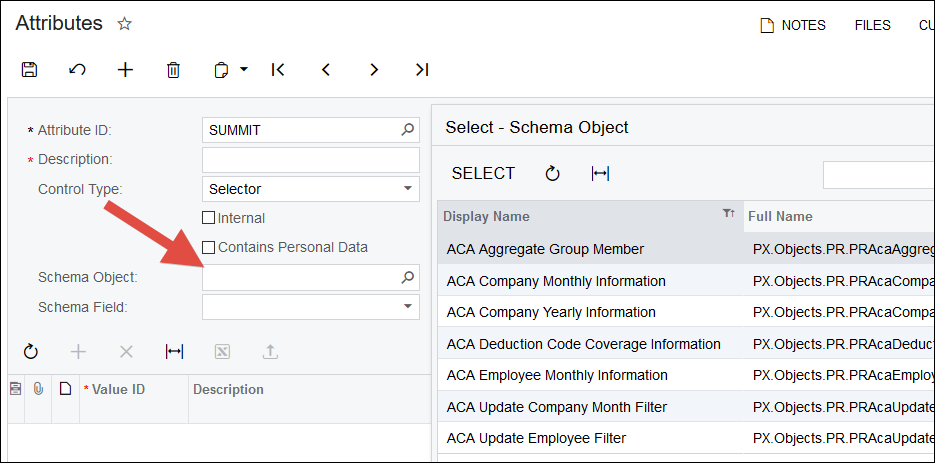
The Schema Control field appears to me to be a list of every object in Acumatica which is a pretty long list.
Once you select a Schema Control, you then select a Schema Field which only displays fields that are lookups (with the magnifying glass), at least as far as I can tell.

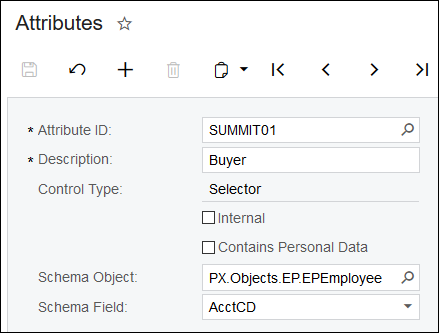
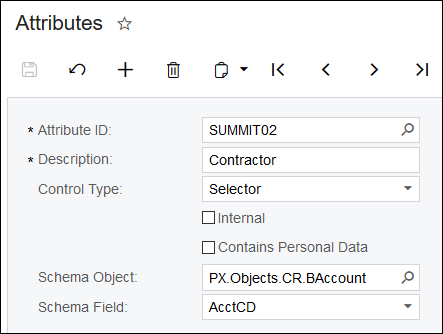
I setup a few Attributes using the Selector, but all of them are either based on the Employee lookup or Business Account lookup pictured below:
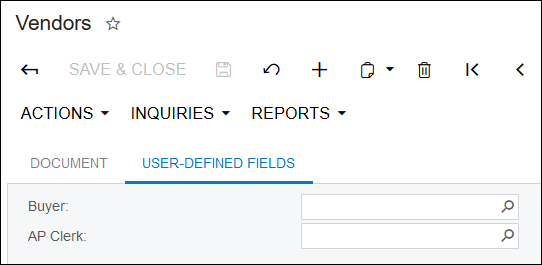
Then I dropped two of the Attributes on the Vendors (AP303000) screen as User-Defined Fields.
The idea here is that you might want to record for each Vendor who the responsible Buyer and AP Clerk are in your organization.
I dropped three of the Attributes on the Opportunities (CR304000) screen as User-Defined Fields.
I took this idea from a client who bids on large construction jobs. Every job has a Contractor, an Engineer, and a Municipality involved (all separate companies). You could use the RELATIONS tab to track this, but it's over complicated. There is only one of each.
Also, by making them User-Defined Fields, it makes reporting A LOT easier than joining to the RELATIONS data and risking a one-to-many relationship.
"Also also," User-Defined Fields are more prominently displayed in the Acumatica Mobile App.
Note that I was not able to get the new Control Type of Selector to work on the ATTRIBUTES tab on either screen. It only works on the USER-DEFINED FIELDS tab.
Awesome, thanks for the info!
Stoked for the Power BI integration
The old app was removed a few months ago as you pointed out.
I just checked and it looks like the new app is available:
https://app.powerbi.com/groups/me/getapps/services

Unfortunately, after you press Get it now, it you get a message that you have to have a Power BI Pro account in order to use it which is a bummer:

Online Members
