
By using this website, you agree to our Terms of Use (click here)
How can I create a dashboard in Acumatica which shows numbers - I am trying to display Net Sales of each salesperson in this month in one column and sales in this year in another column.
In Power BI I tried using VitaraCharts but was not able to get the result .
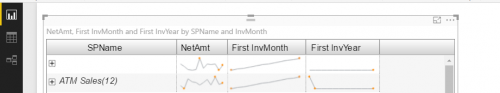
I have created a pivot table in Acumatica which shows Net sales of salesperson in past 13 months.


So you basically want three columns?
1. Salesperson
2. Current Month Sales
3. Year-To-Date Sales
Yes, These 3 columns only
Power BI is better at doing on-the-fly side-by-side Period and YTD calculations, but I think you can still do this in a regular Acumatica Dashboard.
So I modified the Thread Title and removed "Power BI" from the title since I'm learning that most people find Power BI overwhelming.
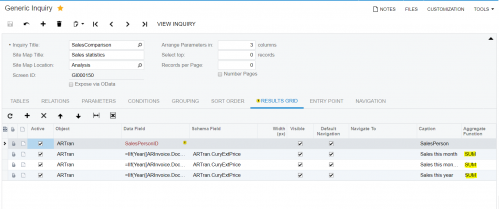
There are a few ways you could visualize it (Pivot Table, Bar Chart, Grouped Generic Inquiry), but the important thing is the create the Generic Inquiry for the underlying data. To do that, I would have two separate columns and use an IIF formula to determine whether to display the amount in that column (one column would only have values for the current month, the other would only have values for the current year). Then, when you sum those columns, you should get the desired results.
Can you please show an example of the GI which would have such two columns using IIF formula?
I put together an 8 minute video. Hopefully this gets you what you need.
Here are the formulas used in the video.
For Month To Date:
=IIf(Year([ARInvoice.DocDate])=Year([AsOfDate]) And Month([ARInvoice.DocDate])=Month([AsOfDate]) And Day([ARInvoice.DocDate])<=Day([AsOfDate]),[ARTran.CuryExtPrice],0)
For Year To Date:
=IIf(Year([ARInvoice.DocDate])=Year([AsOfDate]) And ((Month([ARInvoice.DocDate])<Month([AsOfDate])) Or (Month([ARInvoice.DocDate])=Month([AsOfDate]) And Day([ARInvoice.DocDate])<=Day([AsOfDate]))),[ARTran.CuryExtPrice],0)
Note: Just replace all occurrences of [AsOfDate] with Today() in the formulas if you want to use today's date rather than a parameter.
How can I get sum of all the days in a month? I don't want to display it datewise, I want total sum of sales this month and year
If you just want to filter on Month and not on Date, it actually makes the formulas simpler.
For Month To Date:
=IIf(Year([ARInvoice.DocDate])=Year([AsOfDate]) And Month([ARInvoice.DocDate])=Month([AsOfDate]),[ARTran.CuryExtPrice],0)
For Year To Date:
=IIf(Year([ARInvoice.DocDate])=Year([AsOfDate]) And Month([ARInvoice.DocDate])<=Month([AsOfDate]),[ARTran.CuryExtPrice],0)
If I want to filter Sales this month last year, is this formula right?
=IIf(Year([ARInvoice.DocDate])-1=Year([Today]-1) And Month([ARInvoice.DocDate])=Month([Today]),[ARTran.CuryExtPrice],0)
Also I think the formula for Month to Date sales isn't working correctly, it shows the sales for that particulate date of the docdate rather than making sum of sales in whole month till today
I would use this if you want this month last year
=IIf(Year([ARInvoice.DocDate])=(Year([Today])-1) And Month([ARInvoice.DocDate])=Month([Today]),[ARTran.CuryExtPrice],0)
That formula worked for me. By using the Month function, I'm not sure how it would be only looking at the date of the docdate and not the month of the docdate.
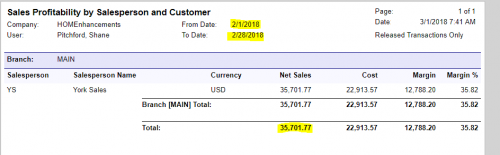
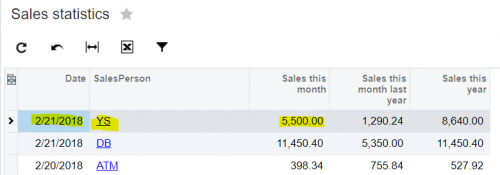
Like for example the Salesperson YS in the screenshot attached the sales for Feb 2018 in the GI we build is 5500 but it shows 35707.77 in Sales Profitability report.
Is it because I have used Groupby Salesperson in the GI Grouping tab?
Can you export the GI to XML and attach the XML file to this thread?
It worked after using the Aggregation function
Online Members
