By using this website, you agree to our Terms of Use (click here)
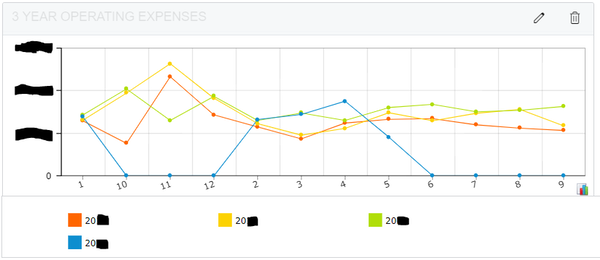
Hoping for some help creating a dashboard where multiple years are laid over the top of each other. I have successfully overlain the years but I am not able to plot the months in ascending order. Instead it plots month 1 January, then 10 October, then 11 November, then 12 December and then months 2-9 February -September. Here are the functions I am using to accomplish what I've done so far.
=CInt(Month([FinPeriod.FinDate]))
I am using this function to convert the fin period to its month component only and then I attempted to use CInt, Cdec, and CSng function to convert the Month number to an integer or decimal so soringt by ascending would align the months from 1-12, January-December. No matter what I use ascension wants to plot 1,10,11,12,,2....9, I assume alphabetically. The following function has the same effect.
=Month([FinPeriod.FinDate])
Is there a better way to do this?
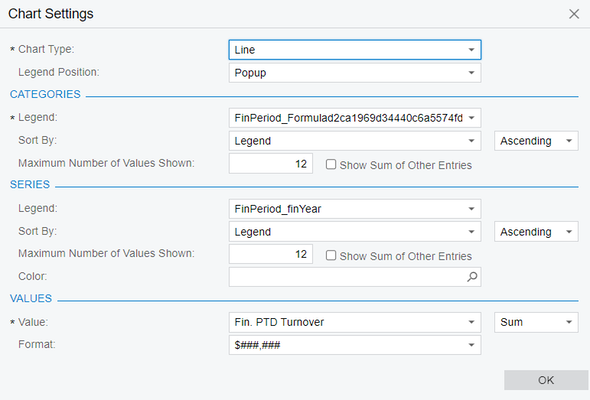
I have included a couple of screenshots showing the current widget and the configuration of that widget.
See screenshots below. Thank you in advance for any help you can offer.
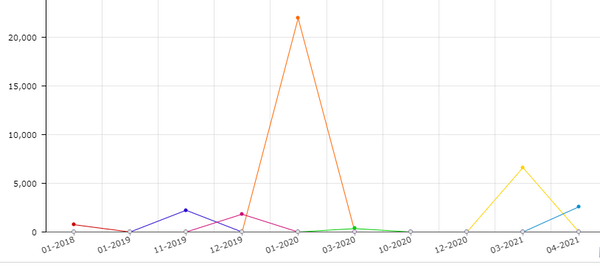
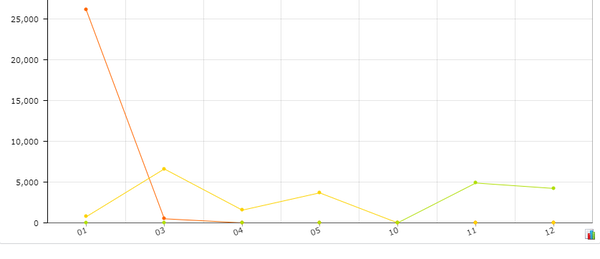
I see. If you convert it to string, it will be sorted 01, 02, 03... 12. I used the following and it worked for me.
=CStr(substring( CStr( [GLTran.FinPeriodID] ), 5, 2 ))
Hi @tra_user
I am glad it worked the way you needed it.
Hey, count me in for Lunch. We never know. LOL.
The Substring function extracts a section within parameters (x an y) from a text. substring(TEXT,x,y) So substring( CStr( [GLTran.FinPeriodID] ), 5, 2 ) it is extracting the two characters after position 5 of string TEXT.
You could try =MonthName([GLTran.TranDate] to get the month name but, when using it, it might sort it alphabetically not from Jan to Dec.


