AugForums.com

An Acumatica User Group

  • Free
    • Start Here
    • Rolodex
    • Podcast
    • Blog
    • Forums
  • Paid
    • AugSQL
    • GI Course
    • GI Library
    • Consulting
  • Register
Acumatica Forums

By using this website, you agree to our Terms of Use (click here)

Forums
AUG Forums
Acumatica Analytica...
Overlapping Data So...
 
Notifications
Clear all

Questions Overlapping Data Sources

 
Acumatica Analytical Report Manager (Financial Report Writer)
Last Post by Tim Rodman 7 years ago
15 Posts
4 Users
0 Reactions
5,782 Views
RSS
beaker
Posts: 26
 beaker
Topic starter
September 29, 2017 9:36 pm
(@beaker)
Trusted Member
Joined: 9 years ago

Hi Everyone,

I've been working with the Financial Report Writer for a while now, but for some reason, something just occurred to me.

There is a Data Source area in four different places:

  • Report Definitions
  • Row Sets
  • Column Sets
  • Unit Sets

Here are some screenshots to prove it:

I don't know why it took me so long to realize this, but it got me thinking, it almost looks like the same list of fields in each of those four places. What happens if I put a value in the same field in all four places? What will happen?


14 Replies
Tim Rodman
Posts: 3199
 Tim Rodman
Admin
September 29, 2017 9:46 pm
(@timrodman)
Famed Member
Joined: 10 years ago

Great question Beaker. And, don't worry, it probably took me even longer for this to occur to me.

There is a great section in the F350 course on this. I'll summarize it here.

Basically, there are two kinds of fields in the Data Source areas:

  • First Non-Empty: For these fields, it will only use one value, and it takes the first non-empty value that it can find, in the following order:
    • Unit Sets
    • Row Sets
    • Column Sets
    • Report Definitions
  • Merged: For these fields, it will combine the values from all four places. So, if you put in a value in all four places, it will combine them all together to create a four-fold filter. If you only put a value in three places, then it only combines three values, etc.


Here is a table representation of which fields exist in what places and whether they use the First Non-Empty logic or the Merged logic.

Note: This post is only concerned with reports of Type GL which are based on the General Ledger. There are also reports of Type PM which are based on the Projects Ledger. I personally don't know Acumatica Projects well enough though to comment on it at this point.

Acumatica Version 6.10.0472 used when composing this response

Reply
Joseph Steele, CPA
 Joseph Steele, CPA
(@joseph-steele-cpa)
Joined: 8 years ago

Member
Posts: 6
November 21, 2017 3:10 pm
Reply toTim RodmanTim Rodman

Hi - new here. Is there any way to allow a column setting on ledger to override the row setting?

I'm running in to the following reporting issue: Rows contain codes in Actual and Statistical ledgers. Column 1 should report those amounts, but i have budgets for the related accounts in column 2. I leave column 1 ledger empty, and set column 2 to Budget. I set rows with statistical accounts to Stat ledger, and report to Actuals, which allows rows to fill in on column 1, column 2 is overridden by Budget on some of the rows. I can't seem to get the statistical accounts to show their respective budgets though.


Reply
beaker
Posts: 26
 beaker
Topic starter
September 29, 2017 9:54 pm
(@beaker)
Trusted Member
Joined: 9 years ago

That reference table is very helpful. Thank you for putting it together Tim.


Reply
Tim Rodman
Posts: 3199
 Tim Rodman
Admin
November 21, 2017 10:52 pm
(@timrodman)
Famed Member
Joined: 10 years ago

As far as I know, the priority is hard coded and the Row Set gets priority.

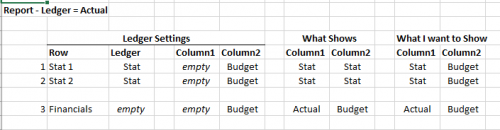
What about setting up two hidden columns: one set to the ACTUAL ledger and one set to the STAT ledger.

Then, the visible column would be a calculated column that pulls from the STAT ledger column if the RowCode is 1 or 2, then from the ACTUAL ledger column for all other rows.


Reply
Joseph Steele, CPA
 Joseph Steele, CPA
(@joseph-steele-cpa)
Joined: 8 years ago

Member
Posts: 6
December 14, 2017 2:39 pm
Reply toTim RodmanTim Rodman

Thanks Tim. I was able to solve this by using two hidden columns summed in to a visible column. I am now, however, experiencing the following issue. The visible column should be a sum column all the way down except for on a couple rows i want it to do a different calculation. How do I achieve this? 

Rough example. Yellow box is the one i would want to be a different calc than the other rows.


Reply
Tim Rodman
Posts: 3199
 Tim Rodman
Admin
December 15, 2017 12:25 am
(@timrodman)
Famed Member
Joined: 10 years ago

Hey Joseph,

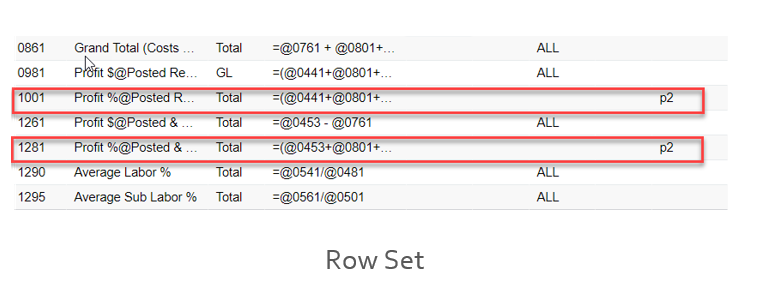
You could do something like this, assuming Row 0030 and 0040 in your Row Set are the rows that you want a different calculation on:

=IIf(@RowCode='0030' Or @RowCode='0040','GL1'/'Stat1',Sum('B','D'))


Reply
Joseph Steele, CPA
Posts: 6
 Joseph Steele, CPA
December 15, 2017 1:09 pm
(@joseph-steele-cpa)
Member
Joined: 8 years ago

Thanks for the direction Tim. I'm not successful in implementing that equation though. I'm running in to trace errors. The rows i'm wanting to divide in to each other are 0005 and 0099, so my equation is as follows:

=IIF(@RowCode='0005',(@RowCode='0099'/@RowCode='0005'),Sum('B','C'))

I've also tried the following:

=IIF(@RowCode='0005',('0099'/'0005'),Sum('B','C'))


Reply
Tim Rodman
Posts: 3199
 Tim Rodman
Admin
December 19, 2017 11:42 pm
(@timrodman)
Famed Member
Joined: 10 years ago

@RowCode just returns the code of the row, not the value in the row. So it works great in a true/false test, but not to return a value.

But I think your trace error is related @RowCode='0099' and @RowCode='0005' being in positions that do not expect a true/false value.

Try something like this instead:

=IIF(@RowCode='0005',B0099/B0005+C0099/C0005),B+C)


Reply
 Armando Asebedo Jr.
(@armando-asebedo-jr)
Joined: 7 years ago

Member
Posts: 4
March 15, 2019 8:31 pm
Reply toTim RodmanTim Rodman

I'm trying to calculate a EAC % gross margin and % profit where I have previous actual period data and forecasted period data being totaled into one column EAC.  Those calculations work in each column but when summed in the EAC column, the report shows the previous column's percentages (14.92%Infinity%22.1%) as text and does not calculate them relative to the summed total in the EAC column.


Thank you in advance


Reply
Tim Rodman
Posts: 3199
 Tim Rodman
Admin
April 1, 2019 8:11 pm
(@timrodman)
Famed Member
Joined: 10 years ago

Hi Armando,

A couple questions:

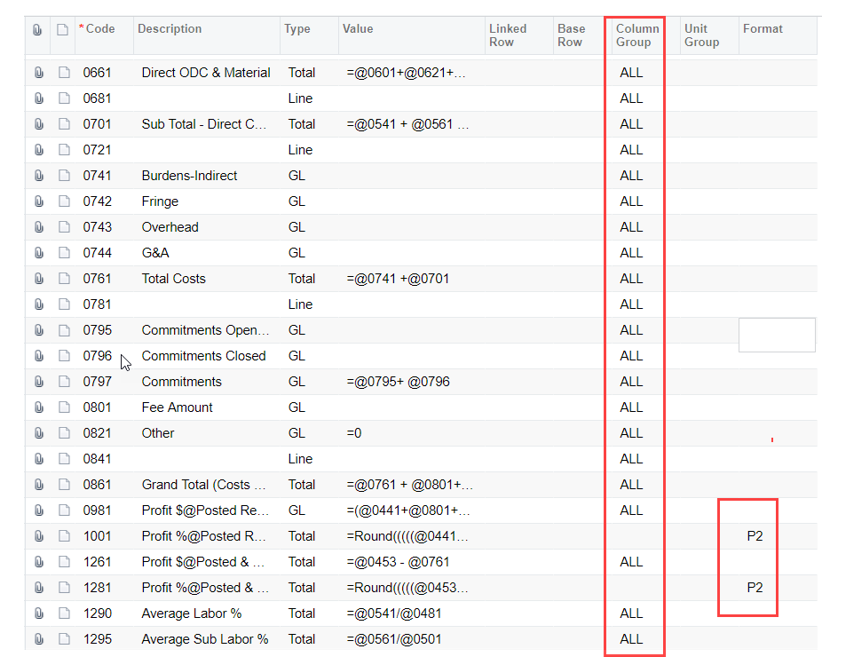
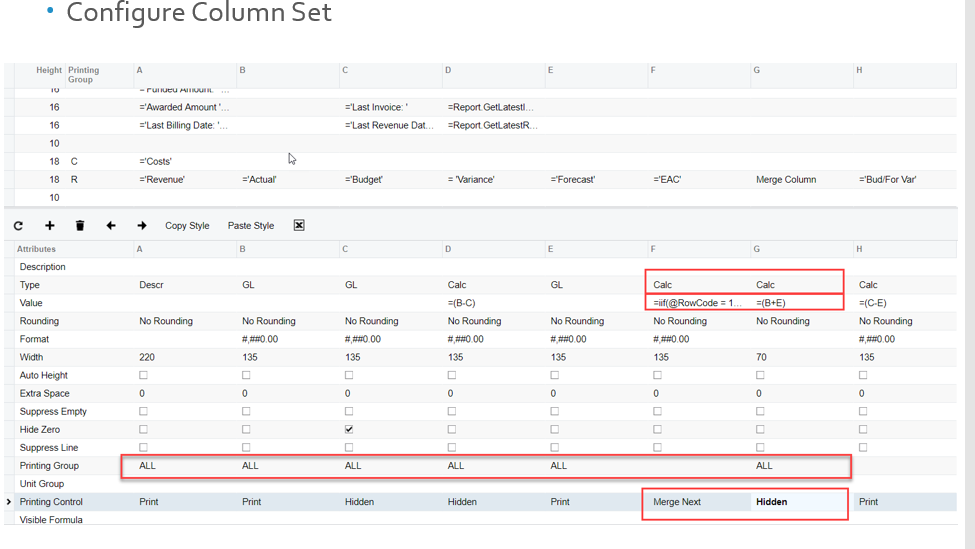
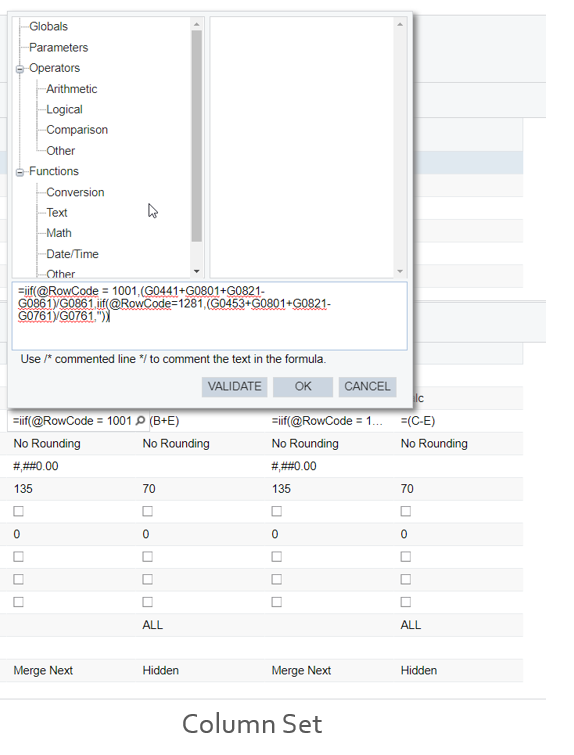
1. Can you include a screenshot of the Column Set? Actually, even better, can you export the report and attach it?

2. Do you really want to sum the percentages in the other columns or would it make more sense to do the division on the total values in the EAC column?


Reply
Posts: 4
 Armando Asebedo Jr.
April 2, 2019 11:34 am
(@armando-asebedo-jr)
Member
Joined: 7 years ago

Tim,

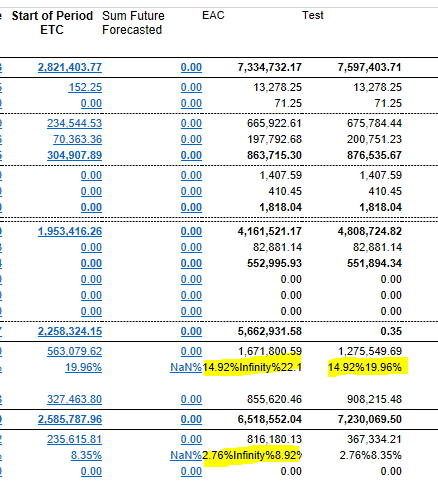
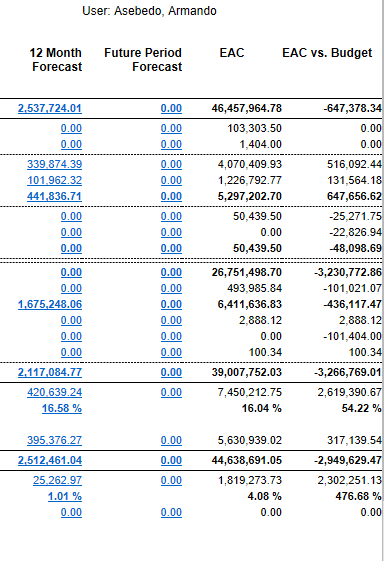
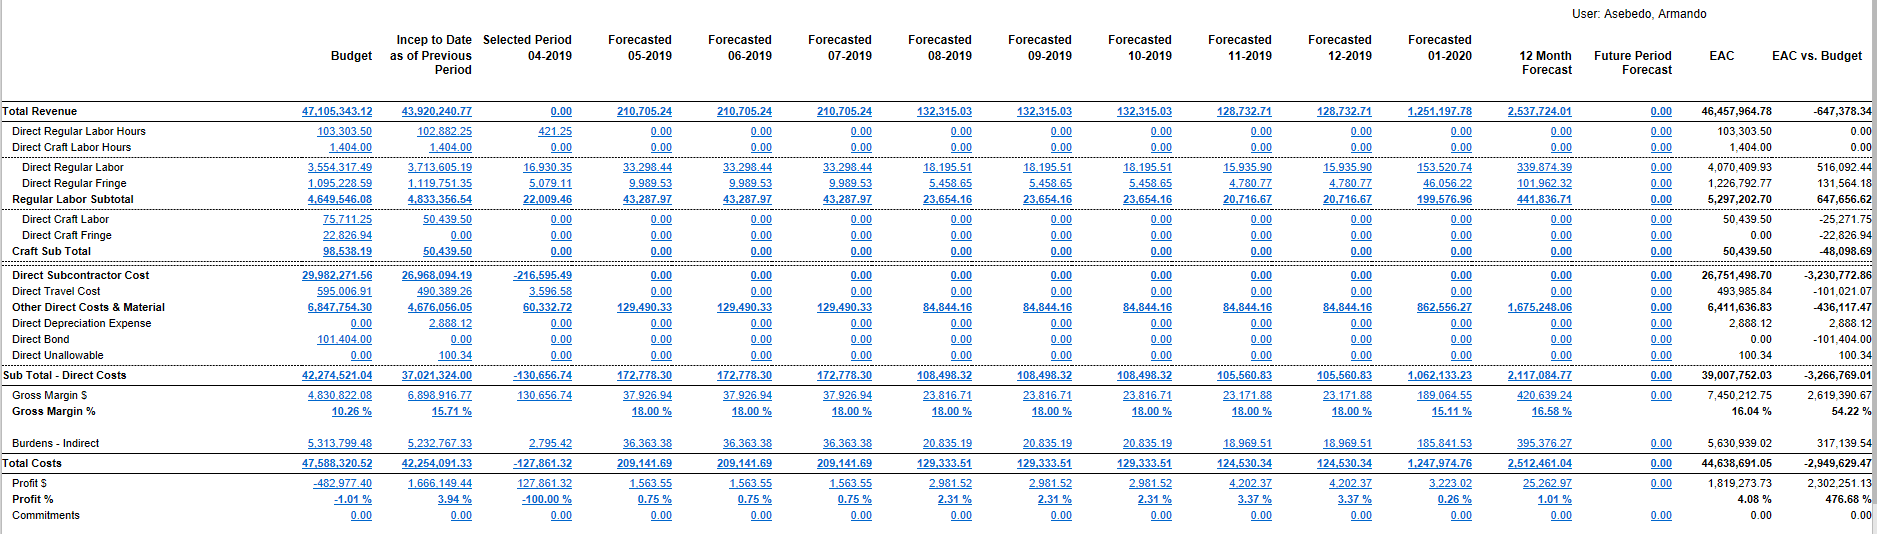
I do need the percentages in each column since I am using this to project gross margin and profit per period, however the EAC column should calculate based on the amount in that specific column.  In looking at the % of Sales Annual Total   thread (which I found after posting here) I thought I was getting closer to making that happen with trying to work with the row sets.  The first solution you posed seemed to work except I have two percentages to calculate in the column so I tried the other solution mentioned but I couldn't get it to work.


Reply
Tim Rodman
Posts: 3199
 Tim Rodman
Admin
April 25, 2019 9:49 pm
(@timrodman)
Famed Member
Joined: 10 years ago

So, should we continue the conversation on that Topic? Here is the link:

https://www.augforums.com/augforums/acumatica-analytical-report-manager-financial-report-writer/of-sales-annual-total/

I'm still struggling to pinpoint your exact issue. I need to be able to reproduce the problem in my environment to pinpoint the exact problem you're trying to solve.


Reply
 Armando Asebedo Jr.
(@armando-asebedo-jr)
Joined: 7 years ago

Member
Posts: 4
April 26, 2019 12:03 pm
Reply toTim RodmanTim Rodman

Tim,  I was able to get what I needed with a little help from my Acumatica provider and some tinkering.  I think what was the issue was not having a Merge Next and Hidden columns with the correct formulas in the Value field, since I couldn't tell the reference columns in the other thread without visuals.  I was just adding the columns which is why I got the previous results.

Using the column group in the Row Set and the Print group on the Column Set 

being mindful of the rows for the percentage calculations to occur in each column 

and then making sure the correct formulas were in the correct column Value field

I got a report (of many columns) that calculates the GM and Profit % in their relevant period column and then the GM and Profit % in a merged EAC calculated column which combines four other columns.  And then for giggles I used the EAC column to calculate a variance from the Budget column.


Thank you again for this forum!! I have learned a lot.


Reply
Tim Rodman
Posts: 3199
 Tim Rodman
Admin
May 5, 2019 7:44 pm
(@timrodman)
Famed Member
Joined: 10 years ago

Thank you for sharing your solution Armando. It's people like you who have caused me to learn a lot from this forum too.


Reply
Forum Jump:
  Previous Topic
Next Topic  
Forum Information
Recent Posts
Unread Posts
Tags
  • 12 Forums
  • 2,527 Topics
  • 10.9 K Posts
  • 30 Online
  • 2,412 Members
Our newest member: Peter Paasch
Latest Post: Can't export GI's to excel that contain the FATrans DAC after upgrade to 2025 R1 in less than 25 min
Forum Icons: Forum contains no unread posts Forum contains unread posts
Topic Icons: Not Replied Replied Active Hot Sticky Unapproved Solved Private Closed

Online Members

 No online members at the moment

Acumatica Forums

Terms of Use & Disclaimers :: Privacy Policy

Copyright © 2026 · AUG Forums, LLC. All rights reserved. This website is not owned, affiliated with, or endorsed by Acumatica, Inc.

‹›×

    ‹›×