
By using this website, you agree to our Terms of Use (click here)

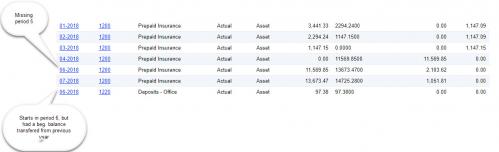
My client would like a dashboard that monthly shows their total assets, liabilities and net worth. The GLHistory file only contains a record if the account had a transaction during the month. So using that file results in incorrect Assets and Liabilities showing on any given month because it only shows those items for the periodID selected that had a transaction. This appears to be an issue anytime you are trying to show any monthly balances of an asset or liability account such as just cash. If you have a cash account that you had no transactions for any given month then its total is not included in the balances showing for your cash accounts so those also show incorrectly. The trial balance report gets around it by bringing in the GLHist file twice with a join to the GLHistoryByPeriod table to see what the last date of the activity was and if it was in the current period or a previous period. I cannot figure out how to do that on a generic inquiry so it can show on the dashboard. Do you have any suggestions? I attached a screen shot of two accounts information in the GLHistory file.
Thanks,

I just did something similar for inventory. It has a similar INItemSiteHistByPeriod table with a FinPeriodLastActive field. The data I want for the query is in INItemSiteHist. So what you need to do is include your source data table twice in the GI. Once for all periods where there is activity and one additional one will be for the last active period as specified in the "HistByPeriod" table. Then in your Results Grid, you need a formula to return the correct amount - if the period is on or before the last active period, you get the amount from the first instance of your data table, otherwise you get it from the 2nd. The 2nd instance of your data table should be only for the period designated as the LastActivePeriod according to the HistByPeriod table.
Here is my formula - the field i want is FinYtdQty:
=IIf( [FinPeriod.StartDate] > [FinPeriodLastActive.StartDate], [INItemSiteHistLastActive.FinYtdQty], [INItemSiteHist.FinYtdQty] )
INItemSiteHist is the 1st instance of the source data table, InItemSiteHistLastActive is the 2nd instance and it is for the LastActivePeriod designated in INItemSiteHistByPeriod. I also had to join the FinPeriod table (twice, one for each source data table) to map periods to dates for comparisons.
It's really difficult to explain this and would be equally difficult to include all screen shots of my GI.
I was able to get it figured out so I am now correctly displaying the YTD balances for balance sheet accounts. Thank you for your help.
Online Members
