Query Quarry has the ambitious goal of giving you access to all of your Acumatica data by means of a massive library of pre-built Acumatica Generic Inquiries.
O ya, and giving you the knowledge that you need to build upon the Query Quarry foundation with blog posts containing sample Microsoft Excel and Power BI Desktop files that are already connected to Query Quarry for you.
Wait, what does that mean?
Well, before we get into the details of what Query Quarry is, let’s step back and consider a few things.
Why do companies implement new ERP systems?
I mean, seriously, why do they take-on such a HUGE headache?
Why do they go through all that pain? All that business process re-engineering. The monotonous data cleansing and data importing. The added stress of basically having their employees work two jobs for a period of time.
They must be crazy right?
Well, obviously, for one reason or another, they do it.
But why do they do it?
Every company is different, but I believe that one common reason why companies implement new ERP systems is that they want better reporting.
They feel trapped by their current system, that they can’t get the information that they want out of it.
My goal with Query Quarry is to ensure that you will never feel “trapped” by your investment in Acumatica. I want you to feel that you can get any data that you want at any time.
I know personally how painful it is to feel trapped by your ERP system. I know how painful it is to feel like your ERP data is trapped behind a veritable Fort Knox of security and complexity. I had that experience when working with Sage 500 (formerly MAS 500).
Hey, speaking of Fort Knox, Acumatica invited me to write a post back in 2015 about OData (more on OData later) and I used the Fort Knox analogy (click here).
When I wrote that post back in 2015, I was already planning to build Query Quarry.
But then I went to work for Acumatica the company so I had to put the project on hold.
Now that I no longer work at Acumatica (for more on that, click here), I finally get to build and launch Query Quarry.
I don’t EVER want you to feel like you can’t get the information that you want out of Acumatica.
Query Quarry can remove your data “shackles” and make you “free” again.
If you ever do need to move to a new ERP system in the future, I want it to be for other reasons, not because you couldn’t get the data that you wanted out of Acumatica.
That’s my goal with Query Quarry.
But, how do we march towards such an ambitious goal?
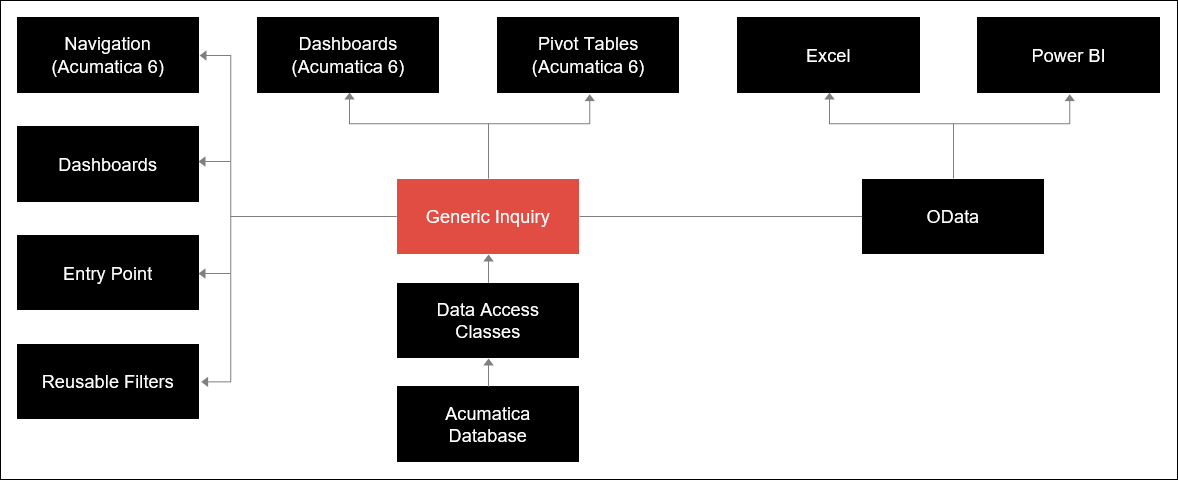
The “Hub” of the “Wheel” in the Acumatica reporting strategy
If you take a look at the Acumatica reporting strategy, they basically have made Generic Inquiry the center, the “hub”, of their reporting strategy.
A Generic Inquiry is just a query in Acumatica that returns rows and columns of data, basically just like an Excel Spreadsheet.
But Generic Inquiry is not an end in itself. It’s the foundational thing upon which so many other things are built.
And I wouldn’t be surprised to see more things added to this in the future.
For example, it would be really cool if the Build Schema area in Report Designer could be replaced with Generic Inquiry so that Report Designer reports would simply point to a Generic Inquiry for their data source. If you think that would be cool, click here to vote on the idea.
It would also be cool to have some sort of data alerting engine built on top of Generic Inquiries. And it looks like Acumatica already has this on their radar (click here).
There are many possibilities in addition to what has already been “built” upon the Generic Inquiry foundation.
But how do you get started with building the Generic Inquiry foundation itself?
How do you create a Generic Inquiry so you can build cool things on top of it?
Well, you really need…
A background in Structured Query Language (SQL), Relational Databases, Tables, Primary Keys, and the Acumatica Schema
Sorry for the long title to this section 🙂
I personally got introduced to SQL back in college when I worked on an open source project using the LAMP stack (Linux, Apache, MySQL, and PHP). The project ran all of the class websites for the social science departments at UCLA.
We used SQL to talk to the database and retrieve data from the database.
Then, when I later got into ERP, I discovered how powerful SQL really can be. You can basically grab data from anywhere in the ERP system and combine it together for amazing insights.
But it takes some time to learn how to write SQL. A basic query is easy, but things can get tricky real fast. Then there are performance problems that could be introduced by writing inefficient queries.
Creating a simple Generic Inquiry in Acumatica is easier than writing SQL because you do things graphically. But it’s a slippery slope and things can quickly go from simple to complex as you start to need more advanced queries.
Another challenge when building Generic Inquiries is understanding the Acumatica Schema. At the time of this writing, there still isn’t an official published “schema” from Acumatica. It’s a lot of hunt-and-peck to navigate the database and learn how things are structured. Do you think there should be an Acumatica Schema? Click here to vote on that idea.
The Inspect Element feature in Acumatica is really nice and it makes building Generic Inquiries A LOT easier than in older ERP systems.
But you still have to understand relational databases, tables, and primary keys if Inspect Element is telling you to pull data from more than one table because combining the tables together can be tricky for beginners.
I worked at Acumatica for one-and-a-half years and, during that time, I got to know the database schema very well.
Wouldn’t it be nice if you could just jump right into creating Dashboards, Pivot Tables, and all of the other cool things that are built on top of Generic Inquiries, without having to build the Generic Inquiries themselves?
Then you wouldn’t have to learn SQL, relational databases, tables, primary keys, and the Acumatica Schema.
If you think that would be nice, then you will love…
Introducing Query Quarry
Ok, so now back to where we left off above about getting into the details of Query Quarry.
First, to recap the goal of Query Quarry: Query Quarry has the ambitious goal of giving you access to all of your Acumatica data by means of a massive library of pre-built Acumatica Generic Inquiries.
But it’s even more than that.
Query Quarry is also:
- A Forum where you can vote on new Generic Inquiries to be included in future releases of Query Quarry
- A New Version of Query Quarry released every quarter that includes new Generic Inquiries requested by the community
- A Community where you can ask questions and view real-word examples of things that you can build with Query Quarry
I will continue to improve Query Quarry by releasing a new version every quarter. Not just bigger, but better.
And everything I do will be based on your feedback, not just some ideas that I concoct alone in isolation. That’s important because strong community is what builds strong products (at least I think that’s the case).
Also, I don’t just want to give you this cool thing called Query Quarry and then walk away saying, “good luck”. I want to help you to use Query Quarry to your full advantage, building cool things on top of it.
So, I will be blogging with examples of things that you can build on top of Query Quarry. And I’ll also post shorter “mini blog posts” in the Query Quarry community forum.
If you purchase Query Quarry or are a member of ARC (click here), then you will be able to post in the Query Quarry forum where you can ask questions about things that you want to build on top of Query Quarry. I can’t always promise an answer, but I do promise a response and I’ll do my best to get you a resolution or at least point you in the right direction.
And all of the other Query Quarry users have access to the same community forum so you can see what kind of questions they are asking. No more having to re-invent the wheel every time you want a new report. No more isolated questions like in traditional support models where only one person benefits from the response.
Cool huh?!?
But, hold on a second, we should probably consider a little about why Query Quarry is so focused on Generic Inquiry and not on Report Designer in Acumatica.
We already talked about Generic Inquiry being the “hub” of the “wheel”. So there’s that reason.
But there’s another reason why Query Quarry is based on Generic Inquiry and not Report Designer…
Generic Inquiry – 80% of the Time, Good Enough
I’ve tested this theory with a number of different ERP consultants and so far they all agree.
The theory is basically this: When someone comes to you asking for a “report”, 80% of the time (or more) they really just want access to the data. They don’t care about having a nicely formatted report. Many times, they are just going to take the data and export it to Microsoft Excel anyways before doing anything with it.
It is MUCH faster to give them a Generic Inquiry rather than spend the time to create a full-blown report using Report Designer.
Why? Because you end up spending 80% of your time in Report Designer on formatting: Getting the field in the right place, resizing everything in order to squeeze another column onto the report, deciding what should be bold and what should have a larger font size, what the background color should be, etc.
With Generic Inquiry, all you have is the data and you allow the user to decide which columns to display, what order they should be displayed in, how wide each column should be, what the sort order should be, etc.
Report Designer is designed for reports that need to be delivered on paper.
Generic Inquiry is designed for reports that need to be delivered on a digital screen (computer, tablet, phone, etc.).
Report Designer is static.
Generic Inquiry is dynamic and interactive.
So, Generic Inquiry is better 80% of the time.
But what about the 20% of the time when someone actually does really want that printed paper report?
Well, then, all is not lost because you can use the Generic Inquiry that you made as a starting point in Report Designer. Generic Inquiry acts as a prototyping tool in this situation. Just open the Generic Inquiry and copy the information into the Build Schema area of Report Designer, then have fun doing all of the formatting stuff that Report Designer is good at doing.
Or, even better, you can build your report using Microsoft Excel or Power BI using the OData connection available in a Generic Inquiry. More on that later.
Back to the 80%. Bottom line, Generic Inquiry is a better tool for the modern world.
Why? Because the modern world is doing this…
Transitioning from Paper to Digital screens
If you think about how people consume information now, more and more it’s from digital screens and less and less from paper.
Think about the email that you just read on your phone, the book that you just read on your Kindle, or your bank balance that you just checked on your mobile app rather than looking for the paper copy that is buried in a stack of papers on your desk.
Hey, even this webpage that you are reading is probably being read on a digital screen (unless some friend of yours printed it out with a sticky note on top that says, “you really should check this out”).
Paper isn’t extinct (I still think that there is a time and a place for it), but its use is definitely declining rapidly.
And this trend will only accelerate as schools replace expensive textbooks with digital devices and the next generation becomes even further distanced from paper.
Personally, looking forward a little bit, I think we will start to see more eInk screens in the workplace. eInk is the technology used by the Amazon Kindle.
Traditional digital screens require a lot of power to run, but eInk screens are very low power and you can have tons of them running all day without killing the electric bill.
In fact, if you walk into the Kohls department store near my house, you will see that all of the pricing signs have been converted to eInk displays. There are tons of small, simple screens, that basically look like black ink on paper. But they have the advantage of being connected devices, so the pricing can easily be mass-changed without someone having to run around and change all of the signs.
Imagine eInk displays in your office.
eInk displays in an office would tie into the real physical world that we live in and deliver information to you with a geographical relevance.
For me, this would make things easier to remember because my brain does a better job of remembering things when they are associated with a physical location.
Maybe I’m standing next to the coffee machine which is out of coffee, but I can see an eInk display showing me when the next shipment of coffee is due to arrive.
Maybe I’m standing in the warehouse next to a product that I think might be obsolete, and I can see an eInk display showing me the last time that someone placed an order for the product.
Maybe I’m standing next to someone’s cubicle and I see an eInk display which tells me when they are taking vacation next (maybe they’ll be out next week).
Or maybe I’m standing on the receiving dock and there is a large eInk display showing me the shipments that we expect to receive today. A quick glance at the truck pulling in, a quick glance at the eInk display, and I have a better idea of what I expect to see on that shipment.
eInk displays positioned throughout an office have the advantage that everyone is seeing the same information and they all know where to go in the office to find it. This would help a lot with the “one version of the truth” problem that many companies face.
And there is a connection between eInk displays and Generic Inquiries. I just don’t have the time to write about it now 🙂
Woah, I wrote a little to much about futuristic eInk displays in the office. Sorry about that. One last note though, the technology is here now, it just isn’t that popular yet. If eInk displays in an office interest you, let me know, because you could be on the leading edge of this adoption and get a leg up on the competition.
Now, let’s get back to the world that we live in today.
Another advantage of digital reports built on Generic Inquiries is that you can layer meaningful analysis on top of them.
That 50 page report stacked on your desk might have some great data in it, but you would have to get out your calculator and start crunching numbers to turn that “raw data” into “insightful information” that you can actually do something with.
Or, at the very least, you would have to flip through the pages to find the meaningful totals on page 13, page 34, and page 50. And now you have to take the staple out to lay those pages next to each other so you can compare the numbers, then staple them back together again when you’re done.
Wouldn’t it be nicer if all of those totals were together in one place?
Digital screens do a better job with totaling (also known as “aggregating”) data.
One reason why is that the interactivity you get on digital screens allows for drill down.
With traditional reports, you have to print all of the detailed data, then maybe indent the totals so your eye can catch them standing out.
But, even though your eye can scan through and catch the totals, the reports are still cluttered with a lot of information, giving you information overload.
Since digital screens are interactive, you can click on a number for more information and be taken to the detailed data.
You are also in a better position with digital screens to enter the world of Business Intelligence where you combine data together from multiple sources and learn some very interesting things like, “how does the weather affect my sales?”
All of this is “digital vs. paper” stuff is not theory to me because I lived it…
My Personal Business Intelligence Experience at The Robbins Company
I worked for a manufacturing company in Cleveland, Ohio for a few years. It was a cool company to work for.
We built large tunnel boring machines that dig tunnels. The “chunnel” from England to France was one of our projects.
These machines are very large (often longer than a football field) and very complicated (requiring a coordinated effort from many engineers with expertise in multiple engineering fields).
When I first started, they had recently implemented a new ERP system and my time was consumed with making the system fit the business better and helping people get comfortable with it.
However, as time went on and the dust began to settle on the implementation, I discovered that there was a constant need that kept coming back up again and again.
There was a constant need for reporting.
It seemed to be that the appetite for information was insatiable. The more reports I delivered, the more they wanted.
My approach to delivering reports in the beginning was to use SQL to query the database.
SQL is really the most powerful and flexible way to query a database. You can get to all of the data and you can then basically do anything that you want with it, especially when you wrap your logic in a stored procedure.
But eventually we got into a situation where there were hundreds of reports floating around.
Yes, hundreds of reports, all delivering various information in various formats.
It was then that I discovered the importance of having a reporting strategy, not just attacking each individual request as an isolated thing, but linking each request back to the overall reporting strategy.
That’s when I started to get into Business Intelligence and Data Warehousing.
I still prefer to use the word “Reports” rather than the two words “Business Intelligence” because I find that “Reports” is the word that most normal people tend to use. But, to me, they are really the same thing.
“Business Intelligence” is simply the next step that you naturally find yourself taking after you discover that you have too many “Reports”.
A reporting strategy is not a flat list of isolated reports individually hitting the database.
A reporting strategy is more like a pyramid where you have reports feeding into other reports that might then feed into still more reports.
The point is that you aren’t reinventing the wheel every time you create a report. You are leveraging the work that was done on previous reports. Leveraging other reports keeps the core logic in one place and allows you to take another step closer to that elusive goal of “one version of the truth”.
Have you ever been in a meeting where the CFO distributes a report around the table?
And there is a total dollar amount for inventory at the bottom of the report. Then the COO distributes their report with a more detailed breakdown of inventory, but there is also a total dollar amount for inventory at the bottom.
AND THE TWO TOTALS DON’T MATCH!!!
I’m pretty sure that this is a fairly common occurrence in many companies.
This is one of the problems that Business Intelligence and “one version of the truth” is designed to solve.
Hey, speaking of meetings and tables, I experienced something really cool at The Robbins Company.
This is along the lines of “digital vs. paper.”
Before I got into Business Intelligence, it would be common to walk passed a conference room and see people sitting around a table, having a meeting, and holding paper in their hands.
Lots of paper, lots of “does everyone have a copy?”, and lots of “let’s all turn to page 5.”
After I got into Business Intelligence, and we began delivering more reports digitally, we purchased some nice flat-screen monitors for the conference rooms.
After that, it would be common to walk passed a conference room and see people sitting around a table, all looking at the same digital screen.
Site note: Flat-screen monitors work so much better than projectors because the display is MUCH crisper and clearer. The older employees who would complain about not being able to read the projector screens (and rightly so) were much happier with the Flat-screen monitors. And those Flat-screen monitors are very affordable now too.
So, now we had people making decisions while everyone was looking at the same information.
And there was another big benefit to this. Maybe someone comes a little late to the meeting and, as they are looking at the numbers on the screen, they might say, “hey, I just fixed that problem in the system right before I came into this meeting.” With paper reports, in this situation, everyone’s paper copy would have suddenly become painfully out-of-date. But, now that they were all looking at the same digital screen, the person controlling the mouse simply had to press the Refresh button and, BAM, their report was updated with live information showing the corrected numbers.
Once you live in the digital display world, you wonder how you ever survived on paper.
I experienced something else at The Robbins Company that was really cool.
The Microsoft Excel Lightbulb
At first, we used a program called Crystal Reports to deliver reports to people. Crystal is a very popular traditional report-writing application. The Report Designer program in Acumatica is similar to Crystal (but nowhere near as robust). For quite a while at The Robbins Company, I happily (and naively) went along creating reports using Crystal Reports.
I was completely oblivious to a powerful tool that was already sitting on my desktop, staring me in the face and waiting for me to discover it.
It took a neighbor of mine, who lived four houses down the street, to shine the light on this tool. For more on that story, click here.
What tool am I talking about? Well, it’s the lowly Excel Pivot Table.
Yes, the guy (me) who was so proud of himself for being able to create virtually any report desired using SQL and Crystal Reports, made the transition to embracing Pivot Tables. “Excel?” you say, “isn’t that for simple-minded people who don’t know that much about computers?” “Well”, I say, “not really”.
You see, Excel has a perception problem. The problem is actually two problems:
- Excel comes bundled with Microsoft Office, just one of several “basic” applications.
- It doesn’t cost very much.
Because of this perception problem, people (like my former self) look down on Excel as a kind of “amateur” data tool.
But my neighbor down the street, Andy, was doing pricing analysis for what is now a billion dollar company. And he’s a really smart guy. Hey, if Excel was good enough for him, why not try it myself right?
It was really weird. I found there to be a strange combination of things with Microsoft Excel.
First, it was a lot faster to deliver a report. Many times I could even do it right there in front of someone while they were in my office.
I like to say that working with Microsoft Excel is like working with clay while working with Crystal Reports (or Acumatica Report Designer) is like working with concrete.
Excel is much more malleable. With Pivot Tables, you can easily change your mind by dragging columns off and on without having to completely rebuild the report.
With Crystal Reports or Acumatica Report Designer, you have to get out the “jack hammer”, tear down the “concrete”, and rebuild the report whenever you change your mind.
Second, and this one was really weird for me, I found that Excel was more powerful.
I was actually able to do more things with it: more complex calculations, better formatting, etc. It was a blow to my “technical prowess ego”, but I eventually learned to just embrace it.
Weird huh?
We live in a new era. It used to be that you had to create reports using report writer programs, programs that were created for software developers, not business users. But now, creating reports is much easier. The tools are better. So rather than fight it, I just learned to embrace it.
Excel also allowed me to handle something that I like to call the Immutable Law of Reporting.
Immutable Law of Reporting: What I Asked For, but not What I Wanted
Let’s consider the old way of doing reporting.
The process was rather clunky. You had to create a detailed requirements document. Then you had to pass it onto a developer and hope that they understood it. Two weeks later the developer would come back to you with the report that you asked for. Many times it would be EXACTLY the report that you asked for.
But then you discovered what is all-too-often the case in report-writing: the report that you asked for wasn’t the report that you wanted.
In reporting, what someone asks for is not really what they want.
Creating reports is an iterative process. It’s not one-way. It’s a conversation, a back-and-forth process during which you are constantly making adjustments, constantly re-evaluating what you thought you wanted based on the results of each step in the process.
In the past, there weren’t the tools available to accommodate this iterative process.
But now there are.
However, even though the tools are better, the process is still the same. Most of the time, you still don’t know what you want until you see it. And, even then, seeing the result tells you more about what you DON’T want, not necessarily what you DO want. Finding what you want is a journey, a long, iterative process that in some cases never ends.
Consider salesperson commissions. Formulas drive behavior, especially with salespeople. The way that you calculate their commissions drives the way that they behave. And sometimes it seems to be a never ending process. The behavior is never quite right. So you keep tweaking the formula, always in pursuit of that illusive perfect result.
Or there is new management at a company. The old guard goes out, the new guard comes in. And so it goes with the reports: the old reports go out, the new reports come in.
It seems that reports just can’t sit still. They are constantly moving, constantly evolving. It’s almost like they are biological, living things that are constantly adapting to the changing environment around them.
This natural eb-and-flow is an immutable law in reporting.
But what’s so new about Excel? Hasn’t it been around for a long time?
And, is Excel really that powerful?
Well, I guess should clarify something.
Excel and the Power BI Trajectory
When I say “Excel,” I’m not talking about your father’s (or mother’s) Excel, what I would call “traditional Excel.”
I’m talking about what was known as Power Pivot when I worked at The Robbins Company.
And what is now known as Power BI.
Think of Power BI as “Excel Pivot Tables on steroids.”
Once we began to use Power BI at The Robbins Company, everyone, including me, loved it.
But, in order to use Power BI, we had to have a foundational set of inquiries.
Or, as Acumatica calls them, Generic Inquiries.
This part was a lot of work. And it was pretty boring.
Query Quarry takes care of the boring hard work needed to embark on your reporting journey.
It’s a foundation, a strong foundation.
Query Quarry is not an end in itself. It’s a foundational beginning, an enabler for many powerful things to come.
In addition to building on the Query Quarry foundation inside of Acumatica, you can build even more powerful things with Excel and Power BI.
Eventually I would like to provide a pre-built Power BI data warehouse that hooks into Query Quarry and show you all of the cool things that you can do with it.
But there are other powerful things too. Things like…
Data-Driven Notifications
Wouldn’t it be nice if you could get an alert on your phone every time an important item runs out of stock? Or maybe something slightly more sophisticated like: notify me whenever someone places an order for an item that is out of stock and the lead time for that item is such that we can’t order it from a vendor and have it arrive in time.
Data-Driven Notifications allow you to proactively manage your business, catching problems when they happen, rather than at the end of the month.
Since Acumatica Generic Inquiries have the ability to connect directly to PowerBI.com, you can build these notifications in PowerBI.com, on top of Query Quarry.
These data-driven alerts can be sent directly to the Power BI mobile app on your phone or they can be sent out by email. The choice is yours.
Reports are an important part of running a company. But it’s easy to become overwhelmed with information and you have to remember to run the report to benefit from the information.
Think of a Data-Driven Notification like a little helper who goes and runs a report, then looks at it to see if there’s anything there that requires your attention. If it finds something interesting, then it sends you an alert to your phone or an email to your inbox.
You can’t run a business entirely with Data-Driven Notifications. But they certainly can help to make your job easier.
Oh, and did I mention that you can do this FOR FREE?
That’s right, you can run a substantial amount of data through PowerBI.com FOR FREE. You only pay when you need to store more than 10GB or when you start to share your work with others. And, due to the highly compressed nature of Power BI, 10GB is about 4-5 times as much data as can be stored in a traditional 10GB Excel file.
There is also a second option for delivering data alerts and this is to use Power Update (click here).
Let’s consider some more things that you can build on the Query Quarry foundation.
Things like…
Dashboards
In addition to building Data-Driven Notifications on top of the Query Quarry foundation, you can also build Dashboards.
Most of the Dashboard Widgets in Acumatica are built on top of a Generic Inquiry. But you need to build the Generic Inquiry first. Unless of course you have Query Quarry 🙂
And when you drill-in to a Dashboard Widget in Acumatica, it takes you to the underlying Generic Inquiry.
Acumatica Dashboards are dependent on Generic Inquiries.
But you aren’t limited to the Dashboards in Acumatica.
Because of the OData connection to PowerBI.com, you can also build Dashboards in Power BI. Even better, you can embed them back into Acumatica so they appear as if they are a part of the Acumatica application.
“Wow”, you say, “that’s a lot of work, why would you do all of that if you’re just going to show the result back inside Acumatica?”
I can see your point. Why not just use the Dashboards that are in Acumatica right?
Why go through all of that trouble and involve another application (Power BI) to create a dashboard? Seems like a lot of unnecessary work right?
I mean, aren’t all Dashboards created equal?
Ah ha! That’s where we have to draw the line. Because all Dashboards are not created equal.
There are hundreds of Dashboard tools out there. And they all have the same basic look-and-feel with the bar charts, the pie charts, the line charts, etc.
Why are there so many different Dashboard tools out there? The reason is that most of them are pre-canned and you have to be a developer to modify them.
Power BI is not a pre-built Dashboard, like most Dashboarding tools.
Power BI is a tool for building Dashboards on your own. This is also known as “self-service reporting” or “self-service business intelligence.”
Where Power BI really shines is with the calculation engine that sits behind the Dashboards. There is A LOT under the hood.
This allows you to calculate numbers that never existed before in your organization (note: that’s not my phrase, but one from my friend Rob Collie).
And many times the number is good enough. It doesn’t matter how pretty it looks. You just need to know the number.
That’s where Power BI can bring major value to the table.
Maybe you want to know what percentage of customers purchased a product in a given month, then returned to purchase the same product in the next month. And you want to see that percentage for the past 12 months.
Or maybe you want to analyze what collection of products your customers are buying. What things do they tend to purchase together? What things are never purchased together? What products have some kind of seasonality associated with them and what products are purchased pretty consistently year-round?
These are calculations that are impossible to do in most Dashboard tools (including the Dashboards in Acumatica), but they are possible in Power BI.
Power BI is not “skin-deep” or “lipstick on a pig” Dashboards.
Actually, Power BI Dashboards are less impressive than other dashboarding tools on the surface, but they really shine with the calculation engine under the hood.
One last thing, and then I’ll shut up about Power BI…
Power BI and Data Mash-Up
Data Mash-Up is when you combine data together from multiple data sources.
The data in Acumatica is very valuable. But it’s even more valuable when you combine it with Census data, Google Analytics data, Industry data from Dunn & Bradstreet, etc.
Combining data from multiple places is known as “mashing up” the data.
This is the world of Business Intelligence and Data Warehousing.
It used to be a world that only big companies could enter because you had to be willing to spend at least $100k just to get started.
Power BI is very good at doing this kind of thing. Power BI was actually started by the SQL Server Analysis team at Microsoft, the team that built the most popular Business Intelligence and Data Warehousing product in the Midmarket.
But when they built Power BI, they aimed at Excel users, not developers.
So you don’t need $100k to do this kind of thing anymore. You just need someone who knows how to write Excel formulas.
Ok, now I’ll shut up about Power BI, at least for now 🙂
Stepping Back
Phew, I know that’s a lot of information.
So let’s take a little break.
Go ahead, go get some water or something.
I’ll wait…
Still waiting…
Caught your breath yet?
Feel refreshed from that glass of water?
Ok, let’s keep moving forward.
So, what was all of that information for?
We’ll, it was just to whet your appetite, to make the point that there is A LOT that you can build on the Query Quarry foundation.
And Query Quarry really is a Quarry, a mine that extracts all of that important data out of Acumatica. It’s a Quarry of Queries, a Query Quarry.
But getting the gold out of a mine isn’t the goal.
Having some big gold nuggets is nice, but we want to do something with them. Like making jewelry, or something like that.
That’s where I can help, by blogging with examples of things that can be built on Query Quarry. By giving you ideas of things you can do with those Query Quarry “gold nuggets”.
Or you can ask questions on the Query Quarry community forum.
And isn’t this the part that you want to do anyways? It’s the fun stuff, the stuff that requires knowledge in your specific industry, the stuff that gets you a promotion from an admin assistant to an analyst, the stuff that makes your boss look good in the monthly management meeting. And when your boss looks good, good things happen for you.
You want to spend your time delivering value.
You don’t want to spend your time down in the mine, down in the quarry, chipping away at the earth, hoping with each swing of the pickax that you’ll find gold.
You don’t want to be down there breathing in the dust, keeping an ear out for the next mine car so you don’t accidentally get run over and killed.
It’s dangerous work. It’s thankless work. It’s boring, tedious work.
Of course, you could do this work yourself.
Then again, you could also build your own car.
Wouldn’t it be better though to focus on driving the car, not building it?
Let me do the “building” so you can do the “driving”.
Let me break my back in the mine, sweating to produce the gold nuggets of Acumatica data.
You can do the fun part, sitting comfortably in the fresh air, sipping lemonade, and building cool stuff on top of the Query Quarry foundation.
Hopefully I’ve convinced you that it’s just not worth spending the time to build this yourself.
Of course, there is also another option…
You Could Hire a Consultant
You could hire a consultant to build a foundational set of Acumatica Generic Inquiries.
And they would probably bill you by the hour.
The problem with this approach is that you would be reinventing the wheel.
I’m already building Query Quarry. I’m investing in it and delivering it at at a cost that is SUBSTANTIALLY lower than what you would pay if you had a consultant build it for you.
And, the thing is, the foundational set of data is pretty standard.
There is a certain structure to Acumatica. And there is only a certain amount of data there. Actually, this is the case with pretty much any ERP system. It doesn’t matter what industry you are in or how small/large your organization is. The core set of Generic Inquiries is pretty consistent across all Acumatica customers.
So Query Quarry really is a product that ANY Acumatica customer can benefit from.
Actually, my goal is that EVERY Acumatica customer will purchase Query Quarry. They won’t even think twice about it.
I really want to make it that compelling.
Of course, what isn’t standard is what you build on top of Query Quarry. That’s where things start to vary across Acumatica customers. Every industry is different, every business model is different, and every executive has their own style of what KPIs they want to see on their Dashboards.
And this is where you might want to hire a consultant.
Don’t hire them to build Query Quarry. Hire them to build on top of the Query Quarry foundation. Because that’s where the real value can be delivered.
You probably wouldn’t hire a consultant to build an iPhone.
But you might hire a consultant to build an app on the iPhone platform.
It’s the same principle with Query Quarry.
Consultants love this too. They don’t want to charge you their typical $150-$200 per hour for the mundane task of “getting the diamonds out of the mine.” They want to do the work that requires skill. They want to cut the diamonds.
So go ahead and hire a consultant. I highly recommend it.
But give them a tool that will make their job a lot easier (and a lot cheaper for you).
Purchase Query Quarry and let your consultant build on top of it.
Are you interested in purchasing Query Quarry?
A Quick Discussion on Licensing
One Query Quarry license is good for one Acumatica instance. Basically that’s one URL.
It doesn’t matter how many Companies you have or how many Branches you have on that Acumatica instance. One license of Query Quarry is good for all of the Companies and Branches on that URL.
And, consistent with Acumatica licensing, it doesn’t matter how many users you have. You only need one Query Quarry license.
Purchasing Query Quarry
When you purchase Query Quarry, during the checkout process you will enter:
- The URL that you want it to be installed on
- The Companies within that URL that you want it installed in
- A Username and Password that has access to the Administrator security role that I can use to perform the installation
Once you have paid for Query Quarry (via a credit card or PayPal), I will then go into your Acumatica instance with the credentials you provided and install Query Quarry.
I can usually do the installation within 24 hours.
In addition to the installation, your purchase includes access to:
- A Forum where you can vote on new Generic Inquiries to be included in future releases of Query Quarry
- A New Version of Query Quarry released every quarter that includes new Generic Inquiries requested by the community
- A Community where you can ask questions and view real-word examples of things that you can build with Query Quarry
This is not software, but a service. I will add Generic Inquiries as they are requested and upgrade you to new versions of Query Quarry (with your permission of course) so long as you have an active Query Quarry membership.
Why am I offering this service?
Because my goal with Query Quarry is to ensure that you will never feel “trapped” by your Acumatica system.
I want you to get the most out of your investment and I know that purchasing Query Quarry is just the start. Then you can learn how to build on top of the Query Quarry foundation and use it to its full potential.
Reporting is a living thing. It’s organic. It grows over time.
And I want to be there with you as you “grow” your investment in Query Quarry.
Your purchase of a Query Quarry membership will give you lifetime access to the Query Quarry Suggestions forum where you can vote on new Generic Inquiries and the Query Quarry Community forum where you can ask questions and view real-world examples. Basically this is #1 and #3 above. Actually, these are just forums within ARC, an Acumatica Reporting Club. So, if you’re already a member of ARC, then you already have access to this. For more on ARC, click here.
Your purchase of Query Quarry will also include access to new versions for one year. This is #2 above. And I will install these new versions for you, once you give me the green light of course. If you want continued access to new versions after that, then you just need to renew your annual Query Quarry membership.
If you don’t renew your annual membership, then Query Quarry will still continue to work. It won’t stop working. You just won’t have access to new versions that include new Generic Inquiries that the community has requested.
The cost of an annual membership for Query Quarry is $999. This price is in USD.
Current Updates
The original idea for Query Quarry is change.
For more information, (click here).